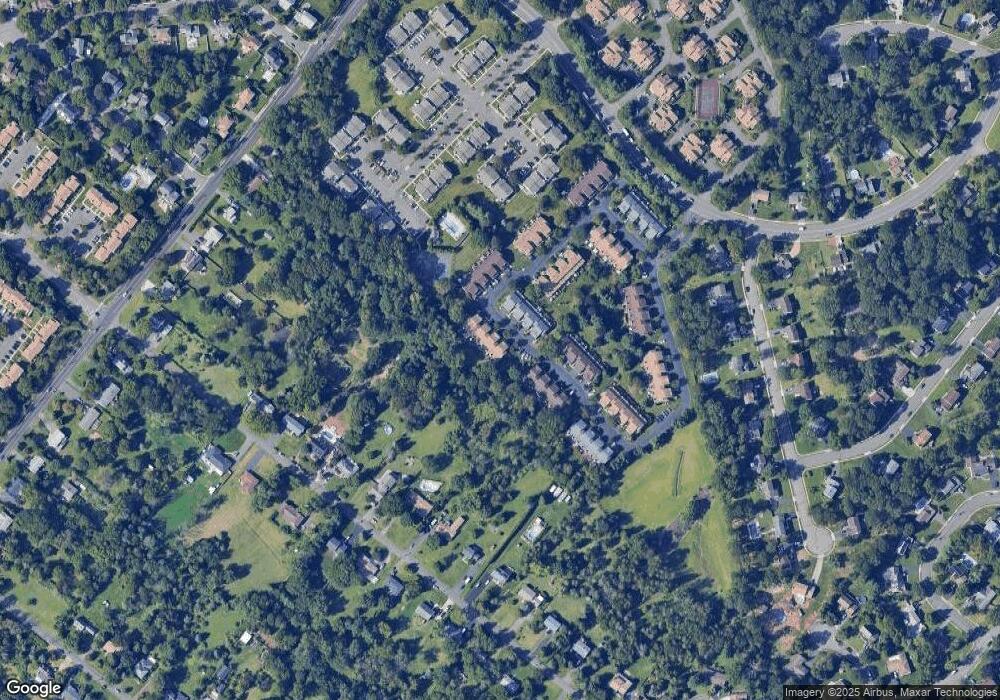
69 Bayberry Dr Somerset, NJ 08873
Estimated Value: $426,950 - $484,000
--
Bed
--
Bath
1,309
Sq Ft
$348/Sq Ft
Est. Value
About This Home
This home is located at 69 Bayberry Dr, Somerset, NJ 08873 and is currently estimated at $455,238, approximately $347 per square foot. 69 Bayberry Dr is a home located in Somerset County with nearby schools including Franklin High School, Thomas Edison EnergySmart Charter School, and Cedar Hill Preparatory School.
Ownership History
Date
Name
Owned For
Owner Type
Purchase Details
Closed on
Oct 28, 2020
Sold by
Foulides Elaine G
Bought by
Chan Romulo T and Chan Doreen G
Current Estimated Value
Home Financials for this Owner
Home Financials are based on the most recent Mortgage that was taken out on this home.
Original Mortgage
$262,500
Outstanding Balance
$233,588
Interest Rate
2.8%
Mortgage Type
New Conventional
Estimated Equity
$221,650
Purchase Details
Closed on
Jan 13, 1999
Sold by
Hippolyte Nicholas
Bought by
Foulides Elaine
Home Financials for this Owner
Home Financials are based on the most recent Mortgage that was taken out on this home.
Original Mortgage
$132,925
Interest Rate
7.39%
Create a Home Valuation Report for This Property
The Home Valuation Report is an in-depth analysis detailing your home's value as well as a comparison with similar homes in the area
Home Values in the Area
Average Home Value in this Area
Purchase History
| Date | Buyer | Sale Price | Title Company |
|---|---|---|---|
| Chan Romulo T | $282,500 | Zwiren Title Agency Inc | |
| Foulides Elaine | $135,000 | -- |
Source: Public Records
Mortgage History
| Date | Status | Borrower | Loan Amount |
|---|---|---|---|
| Open | Chan Romulo T | $262,500 | |
| Previous Owner | Foulides Elaine | $132,925 |
Source: Public Records
Tax History Compared to Growth
Tax History
| Year | Tax Paid | Tax Assessment Tax Assessment Total Assessment is a certain percentage of the fair market value that is determined by local assessors to be the total taxable value of land and additions on the property. | Land | Improvement |
|---|---|---|---|---|
| 2025 | $6,312 | $420,400 | $185,000 | $235,400 |
| 2024 | $6,312 | $347,200 | $170,000 | $177,200 |
| 2023 | $6,125 | $317,200 | $140,000 | $177,200 |
| 2022 | $5,649 | $277,200 | $100,000 | $177,200 |
| 2021 | $4,404 | $262,200 | $85,000 | $177,200 |
| 2020 | $5,710 | $252,200 | $75,000 | $177,200 |
| 2019 | $5,806 | $252,200 | $75,000 | $177,200 |
| 2018 | $5,657 | $243,200 | $70,000 | $173,200 |
| 2017 | $5,560 | $238,200 | $65,000 | $173,200 |
| 2016 | $5,483 | $233,200 | $60,000 | $173,200 |
| 2015 | $5,328 | $228,200 | $55,000 | $173,200 |
| 2014 | $5,483 | $238,200 | $65,000 | $173,200 |
Source: Public Records
Map
Nearby Homes