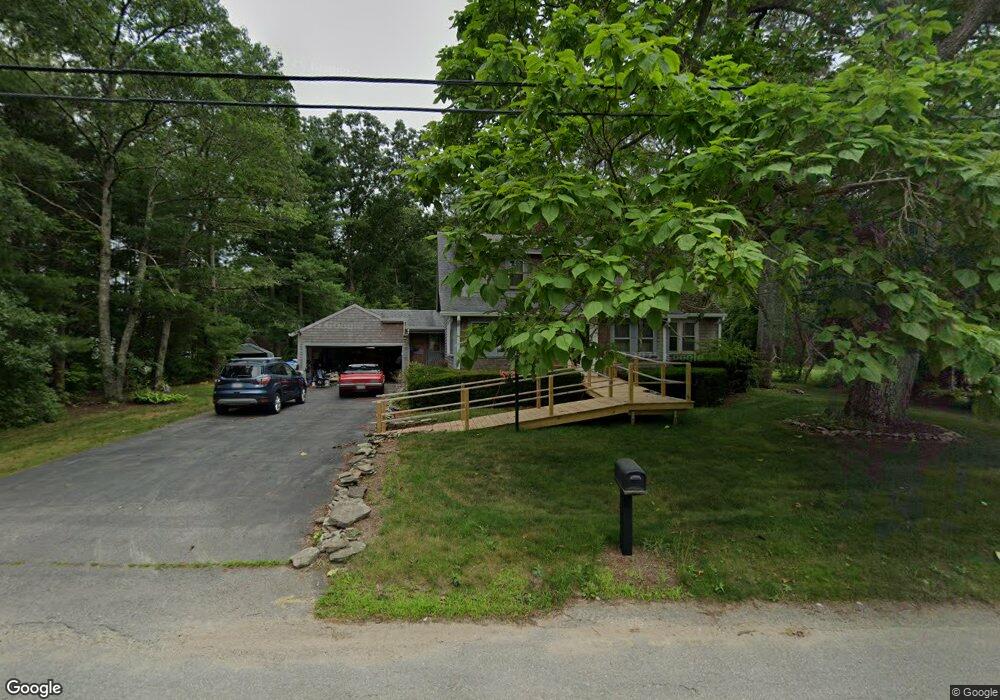
69 Benson St Middleboro, MA 02346
Estimated Value: $461,000 - $613,000
4
Beds
1
Bath
1,572
Sq Ft
$332/Sq Ft
Est. Value
About This Home
This home is located at 69 Benson St, Middleboro, MA 02346 and is currently estimated at $522,516, approximately $332 per square foot. 69 Benson St is a home located in Plymouth County with nearby schools including Mary K. Goode Elementary School.
Ownership History
Date
Name
Owned For
Owner Type
Purchase Details
Closed on
Apr 29, 2024
Sold by
Michaelis Darrel E and Michaelis Pamela J
Bought by
Michaelis Darrel E and Michaelis Pamela J
Current Estimated Value
Purchase Details
Closed on
Jul 16, 1974
Bought by
Michaelis Darrel and Michaelis Pamela
Create a Home Valuation Report for This Property
The Home Valuation Report is an in-depth analysis detailing your home's value as well as a comparison with similar homes in the area
Home Values in the Area
Average Home Value in this Area
Purchase History
| Date | Buyer | Sale Price | Title Company |
|---|---|---|---|
| Michaelis Darrel E | -- | None Available | |
| Michaelis Darrel E | -- | None Available | |
| Michaelis Darrel | -- | -- |
Source: Public Records
Mortgage History
| Date | Status | Borrower | Loan Amount |
|---|---|---|---|
| Previous Owner | Michaelis Darrel | $30,000 | |
| Previous Owner | Michaelis Darrel | $100,000 | |
| Previous Owner | Michaelis Darrel | $40,000 |
Source: Public Records
Tax History Compared to Growth
Tax History
| Year | Tax Paid | Tax Assessment Tax Assessment Total Assessment is a certain percentage of the fair market value that is determined by local assessors to be the total taxable value of land and additions on the property. | Land | Improvement |
|---|---|---|---|---|
| 2025 | $5,619 | $419,000 | $175,800 | $243,200 |
| 2024 | $5,159 | $381,000 | $167,600 | $213,400 |
| 2023 | $4,896 | $343,800 | $167,600 | $176,200 |
| 2022 | $5,014 | $326,000 | $145,700 | $180,300 |
| 2021 | $4,754 | $292,200 | $134,000 | $158,200 |
| 2020 | $4,616 | $290,700 | $134,000 | $156,700 |
| 2019 | $4,457 | $287,900 | $134,000 | $153,900 |
| 2018 | $4,079 | $261,500 | $121,800 | $139,700 |
| 2017 | $3,875 | $245,700 | $117,400 | $128,300 |
| 2016 | $3,297 | $207,100 | $107,300 | $99,800 |
| 2015 | $3,551 | $225,000 | $107,300 | $117,700 |
Source: Public Records
Map
Nearby Homes
- 558 Wareham St
- 3 Sarah Reed Hunt Way
- 571 Wareham St
- 38 John Perkins Way
- 30 Ridge Dr
- 31 Sarah Reed Hunt Way
- 28 Wareham St
- 91 Brookside Dr
- 664 Wareham St
- 146 Miller St
- 480 Wareham St
- Rear Wareham St
- 441 Wareham St
- 386 Wareham St
- 167 Old Miller St
- 425 Wareham St
- 871 Walnut Plain Rd
- 2 Cranberry Cir
- 14 Pineridge Way Unit 14
- 14 Pineridge Way