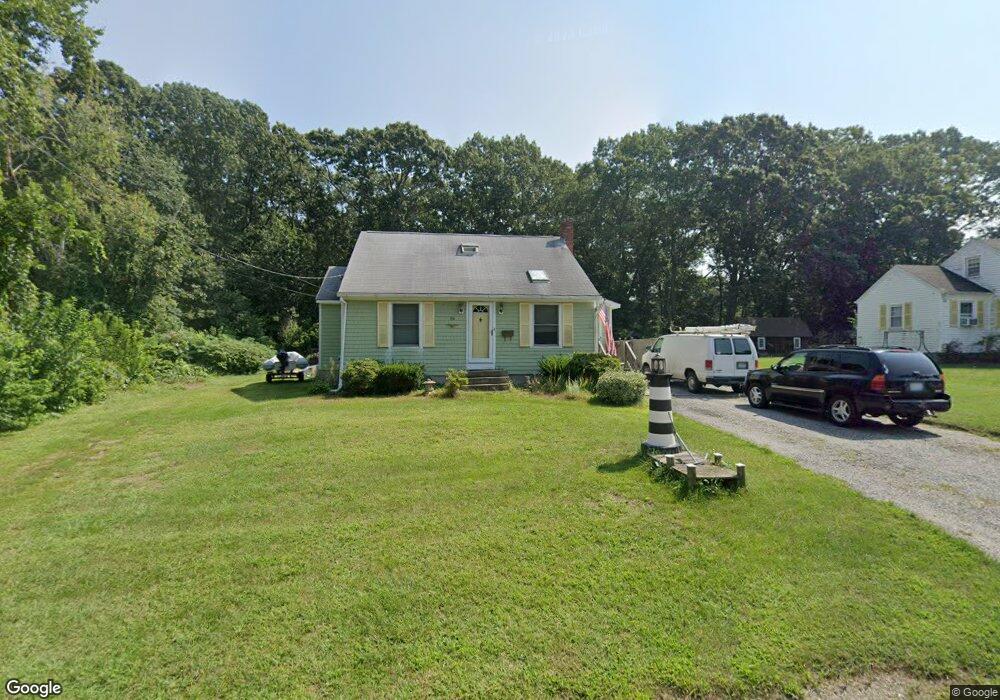
69 Beverly Rd Riverside, RI 02915
Riverside NeighborhoodEstimated Value: $464,000 - $526,000
3
Beds
2
Baths
1,832
Sq Ft
$269/Sq Ft
Est. Value
About This Home
This home is located at 69 Beverly Rd, Riverside, RI 02915 and is currently estimated at $492,901, approximately $269 per square foot. 69 Beverly Rd is a home located in Providence County with nearby schools including East Providence High School, St Luke Elementary School, and Barrington Christian Academy.
Ownership History
Date
Name
Owned For
Owner Type
Purchase Details
Closed on
Sep 24, 1990
Sold by
Phillips Charles V
Bought by
Aparicio Frederick G
Current Estimated Value
Home Financials for this Owner
Home Financials are based on the most recent Mortgage that was taken out on this home.
Original Mortgage
$120,073
Interest Rate
9.89%
Create a Home Valuation Report for This Property
The Home Valuation Report is an in-depth analysis detailing your home's value as well as a comparison with similar homes in the area
Home Values in the Area
Average Home Value in this Area
Purchase History
| Date | Buyer | Sale Price | Title Company |
|---|---|---|---|
| Aparicio Frederick G | $119,000 | -- |
Source: Public Records
Mortgage History
| Date | Status | Borrower | Loan Amount |
|---|---|---|---|
| Open | Aparicio Frederick G | $2,029 | |
| Closed | Aparicio Frederick G | $113,661 | |
| Closed | Aparicio Frederick G | $120,073 |
Source: Public Records
Tax History
| Year | Tax Paid | Tax Assessment Tax Assessment Total Assessment is a certain percentage of the fair market value that is determined by local assessors to be the total taxable value of land and additions on the property. | Land | Improvement |
|---|---|---|---|---|
| 2025 | $5,373 | $411,100 | $138,800 | $272,300 |
| 2024 | $5,350 | $349,000 | $115,600 | $233,400 |
| 2023 | $5,151 | $349,000 | $115,600 | $233,400 |
| 2022 | $4,986 | $228,100 | $63,100 | $165,000 |
| 2021 | $4,904 | $228,100 | $58,500 | $169,600 |
| 2020 | $4,697 | $228,100 | $58,500 | $169,600 |
| 2019 | $4,567 | $228,100 | $58,500 | $169,600 |
| 2018 | $4,921 | $215,100 | $71,600 | $143,500 |
| 2017 | $4,812 | $215,100 | $71,600 | $143,500 |
| 2016 | $4,788 | $215,100 | $71,600 | $143,500 |
| 2015 | $4,728 | $206,000 | $60,500 | $145,500 |
| 2014 | $4,728 | $206,000 | $60,500 | $145,500 |
Source: Public Records
Map
Nearby Homes
Your Personal Tour Guide
Ask me questions while you tour the home.