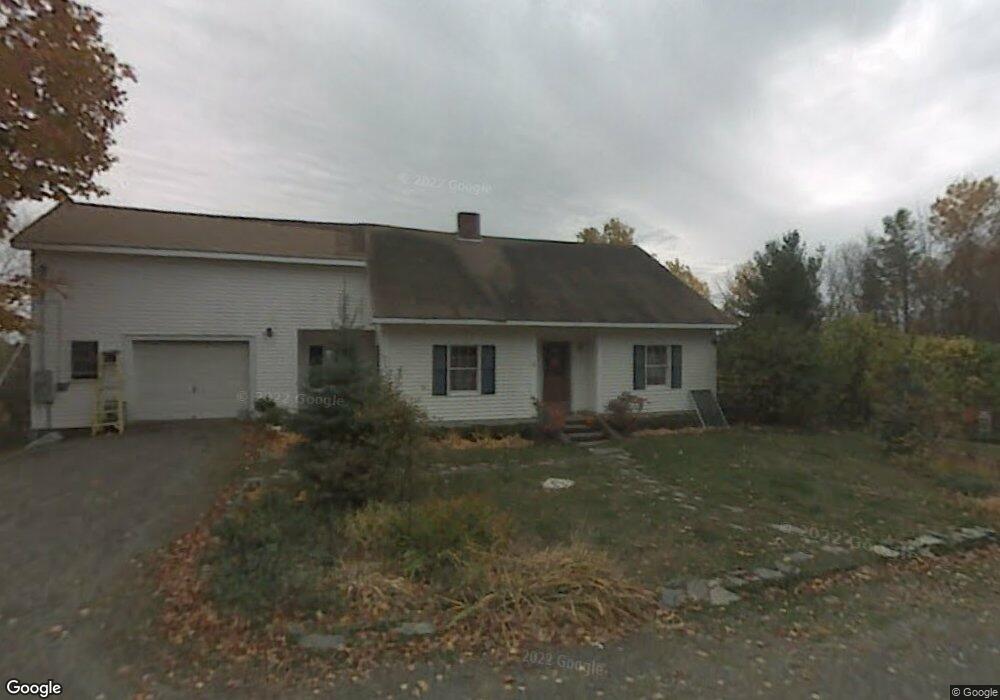
69 Bolton Rd Dover Foxcroft, ME 04426
Estimated Value: $290,000 - $416,000
5
Beds
3
Baths
1,911
Sq Ft
$188/Sq Ft
Est. Value
About This Home
This home is located at 69 Bolton Rd, Dover Foxcroft, ME 04426 and is currently estimated at $358,413, approximately $187 per square foot. 69 Bolton Rd is a home located in Piscataquis County with nearby schools including Se Do Mo Cha Elementary School, Se Do Mo Cha Middle School, and Foxcroft Academy.
Ownership History
Date
Name
Owned For
Owner Type
Purchase Details
Closed on
Aug 9, 2022
Sold by
Smith-Stevens Susan and Stevens Mark E
Bought by
Smith-Stevens Susan and Rollins Rebecca L
Current Estimated Value
Home Financials for this Owner
Home Financials are based on the most recent Mortgage that was taken out on this home.
Original Mortgage
$185,000
Outstanding Balance
$176,667
Interest Rate
5.7%
Mortgage Type
Purchase Money Mortgage
Estimated Equity
$181,746
Create a Home Valuation Report for This Property
The Home Valuation Report is an in-depth analysis detailing your home's value as well as a comparison with similar homes in the area
Home Values in the Area
Average Home Value in this Area
Purchase History
| Date | Buyer | Sale Price | Title Company |
|---|---|---|---|
| Smith-Stevens Susan | -- | None Available |
Source: Public Records
Mortgage History
| Date | Status | Borrower | Loan Amount |
|---|---|---|---|
| Open | Smith-Stevens Susan | $185,000 |
Source: Public Records
Tax History Compared to Growth
Tax History
| Year | Tax Paid | Tax Assessment Tax Assessment Total Assessment is a certain percentage of the fair market value that is determined by local assessors to be the total taxable value of land and additions on the property. | Land | Improvement |
|---|---|---|---|---|
| 2024 | $3,917 | $230,400 | $34,400 | $196,000 |
| 2023 | $3,510 | $189,200 | $31,800 | $157,400 |
| 2022 | $3,360 | $168,000 | $29,100 | $138,900 |
| 2021 | $3,414 | $158,800 | $26,500 | $132,300 |
| 2020 | $3,398 | $158,800 | $26,500 | $132,300 |
| 2019 | $3,414 | $158,800 | $26,500 | $132,300 |
| 2018 | $3,367 | $158,800 | $26,500 | $132,300 |
| 2017 | $3,319 | $158,800 | $26,500 | $132,300 |
| 2016 | $3,216 | $158,800 | $26,500 | $132,300 |
| 2015 | $2,954 | $158,800 | $26,500 | $132,300 |
| 2014 | $2,898 | $158,800 | $26,500 | $132,300 |
| 2013 | $2,803 | $158,800 | $26,500 | $132,300 |
Source: Public Records
Map
Nearby Homes
- 53 Bolton Rd
- 50 Bolton Rd
- 80 Bolton Rd
- 43 Bolton Rd
- 98 Bolton Rd
- 31 Bolton Rd
- 6 Bunker Way
- 35 Bolton
- 121 Bolton Rd
- M14L31-4 Greeleys Landing Rd
- TBD Greeley's Landing Rd
- 123 Bolton Rd
- 120 Bolton Rd
- 00 Greeleys Landing Rd
- 463 Greeleys Landing Rd
- 477 Greeleys Landing
- 0 Bolton Rd
- 645 Greeleys Landing Rd
- Lot 20 Holmes Rd
- 2 Holmes