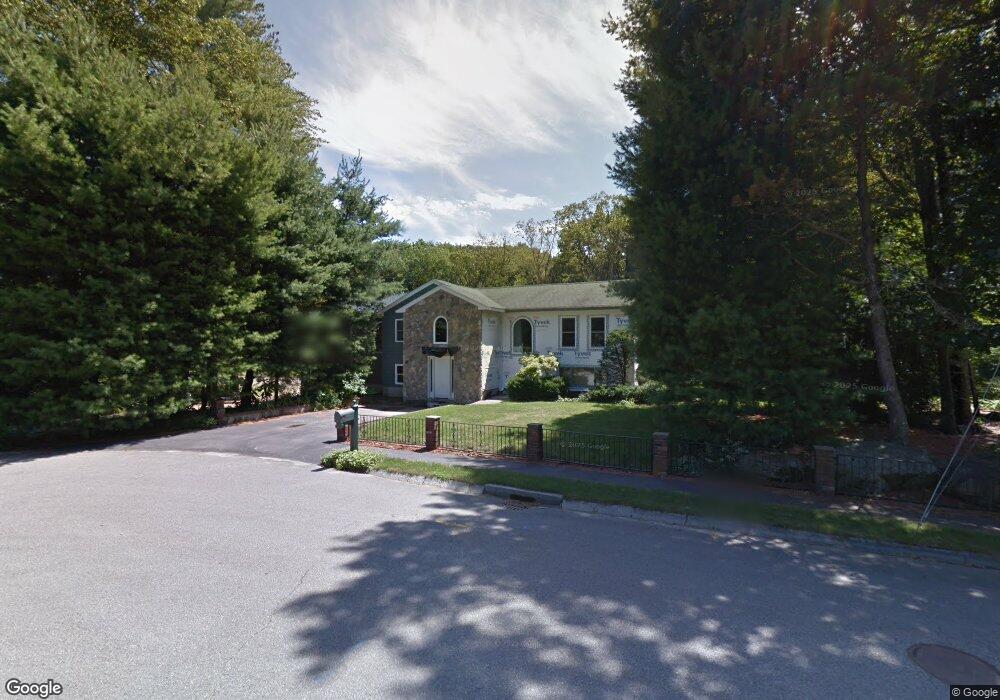
69 Borrows Rd Foxboro, MA 02035
Estimated Value: $781,000 - $924,000
3
Beds
2
Baths
2,038
Sq Ft
$417/Sq Ft
Est. Value
About This Home
This home is located at 69 Borrows Rd, Foxboro, MA 02035 and is currently estimated at $848,974, approximately $416 per square foot. 69 Borrows Rd is a home located in Norfolk County with nearby schools including Foxborough High School, Discovery Daycare Center, and Hands-On-Montessori School.
Ownership History
Date
Name
Owned For
Owner Type
Purchase Details
Closed on
Jun 23, 2006
Sold by
Ramer Christine and Ramer John
Bought by
Johnson Zachary M
Current Estimated Value
Home Financials for this Owner
Home Financials are based on the most recent Mortgage that was taken out on this home.
Original Mortgage
$346,400
Outstanding Balance
$203,883
Interest Rate
6.59%
Mortgage Type
Purchase Money Mortgage
Estimated Equity
$645,091
Purchase Details
Closed on
Feb 27, 2003
Sold by
G Lorusso & Sons Const
Bought by
Ramer Christine M and Ramer John
Home Financials for this Owner
Home Financials are based on the most recent Mortgage that was taken out on this home.
Original Mortgage
$15,000
Interest Rate
5.98%
Mortgage Type
Purchase Money Mortgage
Create a Home Valuation Report for This Property
The Home Valuation Report is an in-depth analysis detailing your home's value as well as a comparison with similar homes in the area
Home Values in the Area
Average Home Value in this Area
Purchase History
| Date | Buyer | Sale Price | Title Company |
|---|---|---|---|
| Johnson Zachary M | $433,000 | -- | |
| Ramer Christine M | $15,000 | -- |
Source: Public Records
Mortgage History
| Date | Status | Borrower | Loan Amount |
|---|---|---|---|
| Open | Johnson Zachary M | $346,400 | |
| Previous Owner | Ramer Christine M | $15,000 |
Source: Public Records
Tax History
| Year | Tax Paid | Tax Assessment Tax Assessment Total Assessment is a certain percentage of the fair market value that is determined by local assessors to be the total taxable value of land and additions on the property. | Land | Improvement |
|---|---|---|---|---|
| 2025 | $11,754 | $889,100 | $239,800 | $649,300 |
| 2024 | $10,287 | $761,400 | $244,100 | $517,300 |
| 2023 | $9,911 | $697,500 | $232,400 | $465,100 |
| 2022 | $9,171 | $631,600 | $194,900 | $436,700 |
| 2021 | $8,235 | $558,700 | $180,500 | $378,200 |
| 2020 | $7,217 | $495,300 | $180,500 | $314,800 |
| 2019 | $1,260 | $484,500 | $171,800 | $312,700 |
| 2018 | $6,900 | $473,600 | $171,800 | $301,800 |
| 2017 | $6,750 | $448,800 | $160,600 | $288,200 |
| 2016 | $6,872 | $463,700 | $161,900 | $301,800 |
| 2015 | $6,715 | $442,100 | $136,900 | $305,200 |
| 2014 | $6,492 | $433,100 | $127,900 | $305,200 |
Source: Public Records
Map
Nearby Homes
- 128 Tremont St
- 1769 West St
- 346 South St
- 24 Maverick Dr
- 40 Treasure Island Rd
- 16 Treasure Island Rd
- 85 Jewell St
- 33 Colonial Way
- 9 Coach Rd
- 46 Mirimichi St
- 84 Messenger St
- 356 Central St
- 155 South St
- 166 Chauncy St
- 150 Gilbert St
- 14 Claire Ave
- 25 Munroe Dr
- 233 Central St
- 150 Rumford Ave Unit 110
- 157 Central St
Your Personal Tour Guide
Ask me questions while you tour the home.