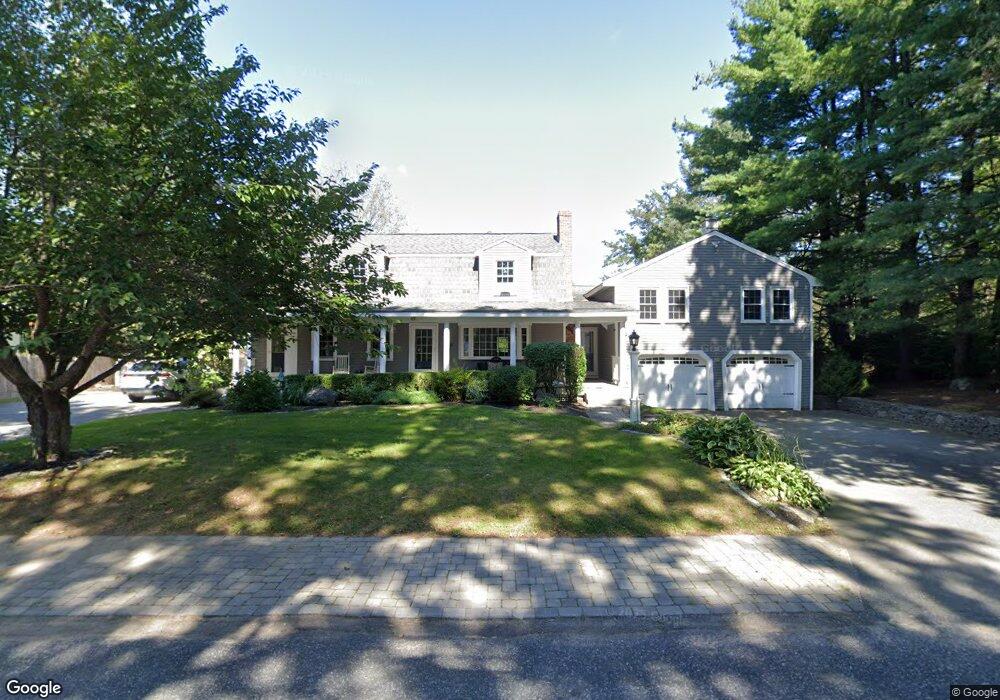
69 Bridge St Medfield, MA 02052
Estimated Value: $1,366,000 - $1,547,000
5
Beds
4
Baths
4,010
Sq Ft
$364/Sq Ft
Est. Value
About This Home
This home is located at 69 Bridge St, Medfield, MA 02052 and is currently estimated at $1,458,451, approximately $363 per square foot. 69 Bridge St is a home located in Norfolk County with nearby schools including Memorial School, Ralph Wheelock School, and Dale Street School.
Ownership History
Date
Name
Owned For
Owner Type
Purchase Details
Closed on
Nov 4, 1999
Sold by
Counihan Robert J and Counihan Mary P
Bought by
Sawan George J
Current Estimated Value
Create a Home Valuation Report for This Property
The Home Valuation Report is an in-depth analysis detailing your home's value as well as a comparison with similar homes in the area
Home Values in the Area
Average Home Value in this Area
Purchase History
| Date | Buyer | Sale Price | Title Company |
|---|---|---|---|
| Sawan George J | $380,000 | -- |
Source: Public Records
Mortgage History
| Date | Status | Borrower | Loan Amount |
|---|---|---|---|
| Open | Sawan George J | $287,000 |
Source: Public Records
Tax History Compared to Growth
Tax History
| Year | Tax Paid | Tax Assessment Tax Assessment Total Assessment is a certain percentage of the fair market value that is determined by local assessors to be the total taxable value of land and additions on the property. | Land | Improvement |
|---|---|---|---|---|
| 2025 | $15,493 | $1,122,700 | $425,000 | $697,700 |
| 2024 | $15,169 | $1,036,100 | $385,400 | $650,700 |
| 2023 | $15,060 | $976,000 | $367,900 | $608,100 |
| 2022 | $14,570 | $836,400 | $350,400 | $486,000 |
| 2021 | $14,146 | $796,500 | $341,600 | $454,900 |
| 2020 | $13,891 | $779,100 | $338,100 | $441,000 |
| 2019 | $13,399 | $749,800 | $332,900 | $416,900 |
| 2018 | $12,423 | $729,500 | $322,400 | $407,100 |
| 2017 | $12,085 | $715,500 | $308,400 | $407,100 |
| 2016 | $11,837 | $706,700 | $299,600 | $407,100 |
| 2015 | $10,984 | $684,800 | $292,800 | $392,000 |
| 2014 | $10,405 | $645,500 | $253,500 | $392,000 |
Source: Public Records
Map
Nearby Homes
- 75 Bridge St
- 80 West St
- 3 Hennery Way Bld E Unit 3
- 8 Turtlebrook Way
- 46 Frairy St
- 14 Harding St
- 34 Frairy St
- 37 Crestview Dr
- 5 Prentiss Place Unit 5
- 435 Main St Unit B
- 431 Main St Unit 5
- 12 Spruce Way
- 6 Rivendell Ln
- 18 Village St
- 94 Pleasant St
- 3 Shining Valley Cir
- 64 Village St
- 21 Philip St
- 00000 S Main St and Bullard St
- 20 Hemlock Cir