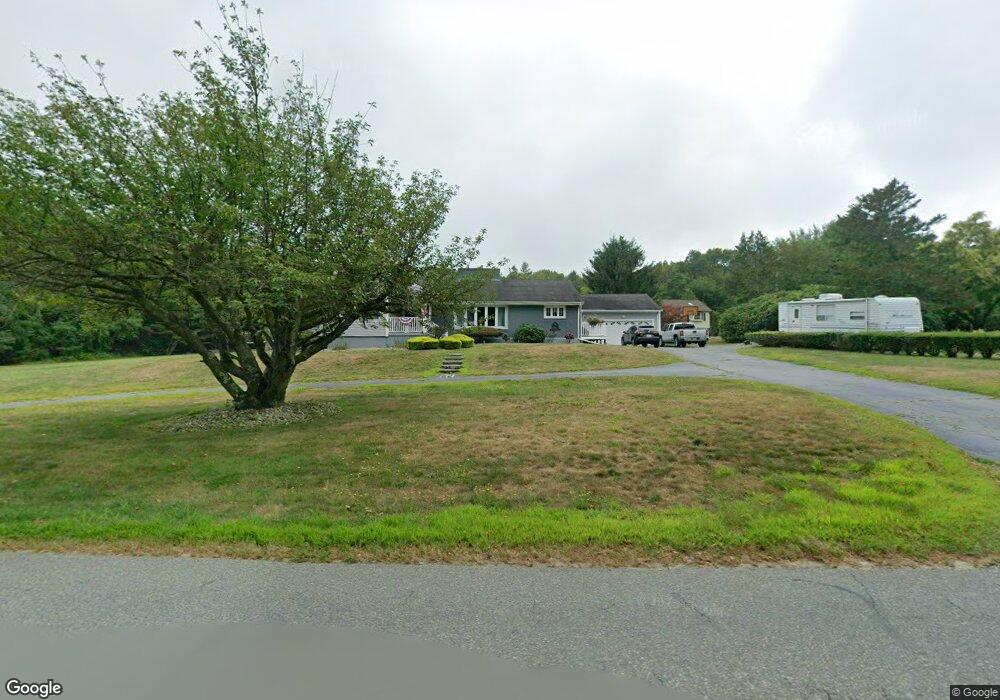
69 Bryant St Berkley, MA 02779
Berkley Bridge/Lower Berkley NeighborhoodEstimated Value: $609,000 - $741,000
3
Beds
2
Baths
2,231
Sq Ft
$310/Sq Ft
Est. Value
About This Home
This home is located at 69 Bryant St, Berkley, MA 02779 and is currently estimated at $691,710, approximately $310 per square foot. 69 Bryant St is a home located in Bristol County with nearby schools including Berkley Community School.
Ownership History
Date
Name
Owned For
Owner Type
Purchase Details
Closed on
Nov 24, 1999
Sold by
Parsons Peter N and Parsons Debra A
Bought by
Simons Scott A and Simons Jennifer B
Current Estimated Value
Home Financials for this Owner
Home Financials are based on the most recent Mortgage that was taken out on this home.
Original Mortgage
$166,500
Interest Rate
7.77%
Mortgage Type
Purchase Money Mortgage
Purchase Details
Closed on
Jun 2, 1992
Sold by
Fizell Roy H and Fizell Carol A
Bought by
Sylvia Jack P
Home Financials for this Owner
Home Financials are based on the most recent Mortgage that was taken out on this home.
Original Mortgage
$95,300
Interest Rate
8.7%
Mortgage Type
Purchase Money Mortgage
Create a Home Valuation Report for This Property
The Home Valuation Report is an in-depth analysis detailing your home's value as well as a comparison with similar homes in the area
Home Values in the Area
Average Home Value in this Area
Purchase History
| Date | Buyer | Sale Price | Title Company |
|---|---|---|---|
| Simons Scott A | $185,000 | -- | |
| Sylvia Jack P | $43,000 | -- |
Source: Public Records
Mortgage History
| Date | Status | Borrower | Loan Amount |
|---|---|---|---|
| Open | Sylvia Jack P | $210,000 | |
| Closed | Sylvia Jack P | $166,500 | |
| Previous Owner | Sylvia Jack P | $154,400 | |
| Previous Owner | Sylvia Jack P | $95,300 |
Source: Public Records
Tax History Compared to Growth
Tax History
| Year | Tax Paid | Tax Assessment Tax Assessment Total Assessment is a certain percentage of the fair market value that is determined by local assessors to be the total taxable value of land and additions on the property. | Land | Improvement |
|---|---|---|---|---|
| 2025 | $75 | $627,300 | $152,500 | $474,800 |
| 2024 | $7,252 | $582,500 | $131,400 | $451,100 |
| 2023 | $6,903 | $522,200 | $131,400 | $390,800 |
| 2022 | $6,764 | $491,900 | $114,200 | $377,700 |
| 2021 | $6,576 | $460,500 | $108,800 | $351,700 |
| 2020 | $6,444 | $443,500 | $96,100 | $347,400 |
| 2019 | $6,248 | $426,800 | $96,100 | $330,700 |
| 2018 | $3,606 | $408,400 | $92,500 | $315,900 |
| 2017 | $5,507 | $385,100 | $103,600 | $281,500 |
| 2016 | $5,231 | $352,500 | $103,600 | $248,900 |
| 2015 | $4,746 | $341,200 | $103,600 | $237,600 |
| 2014 | $4,526 | $353,300 | $112,400 | $240,900 |
Source: Public Records
Map
Nearby Homes