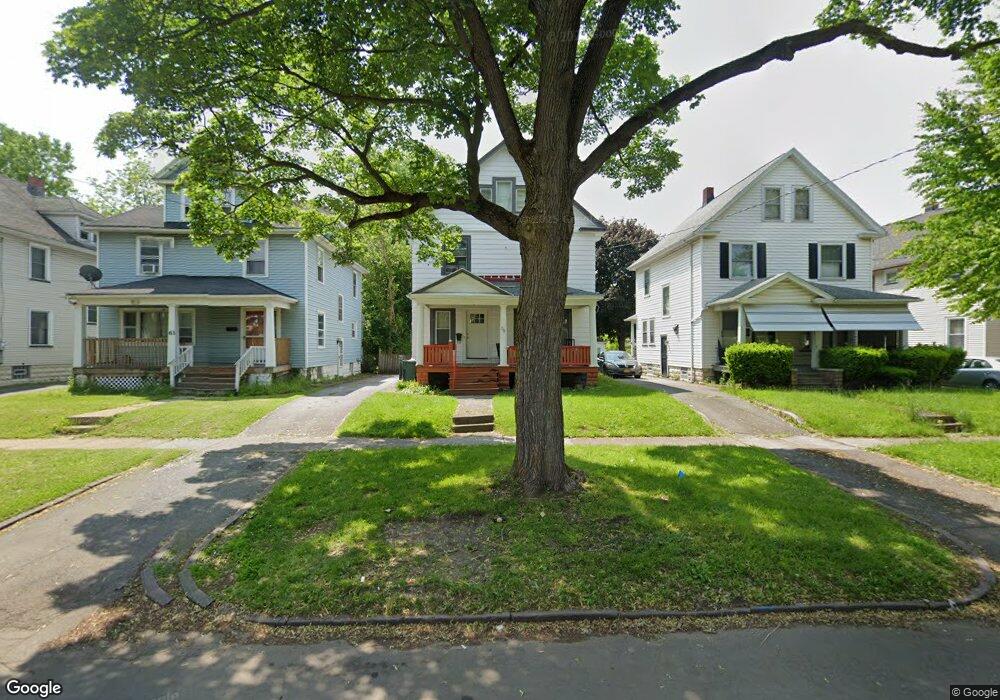
69 Burrows St Rochester, NY 14606
Lyell-Otis NeighborhoodEstimated Value: $116,000 - $148,543
4
Beds
2
Baths
1,700
Sq Ft
$77/Sq Ft
Est. Value
About This Home
This home is located at 69 Burrows St, Rochester, NY 14606 and is currently estimated at $131,636, approximately $77 per square foot. 69 Burrows St is a home located in Monroe County with nearby schools including Enrico Fermi School No. 17, Dr. Louis A. Cerulli School No. 34, and John Williams School No. 5.
Ownership History
Date
Name
Owned For
Owner Type
Purchase Details
Closed on
Jan 19, 2022
Sold by
Gary Bitetti and Tran Heiu
Bought by
Tirado Carlos
Current Estimated Value
Purchase Details
Closed on
Jan 12, 2013
Sold by
Tran Nghia
Bought by
Tran Hau
Purchase Details
Closed on
Jan 18, 2007
Sold by
Burks Von
Bought by
Tran Nghia
Purchase Details
Closed on
Apr 19, 2002
Sold by
Federal National Mtg Asso
Bought by
Von Burks
Purchase Details
Closed on
Feb 7, 2002
Sold by
Taylor Rachel Est Of
Bought by
Federal National Mtg Asso
Create a Home Valuation Report for This Property
The Home Valuation Report is an in-depth analysis detailing your home's value as well as a comparison with similar homes in the area
Home Values in the Area
Average Home Value in this Area
Purchase History
| Date | Buyer | Sale Price | Title Company |
|---|---|---|---|
| Tirado Carlos | $29,000 | None Listed On Document | |
| Tran Hau | -- | None Available | |
| Tran Nghia | $25,000 | -- | |
| Von Burks | $35,000 | -- | |
| Federal National Mtg Asso | $60,696 | -- |
Source: Public Records
Tax History Compared to Growth
Tax History
| Year | Tax Paid | Tax Assessment Tax Assessment Total Assessment is a certain percentage of the fair market value that is determined by local assessors to be the total taxable value of land and additions on the property. | Land | Improvement |
|---|---|---|---|---|
| 2024 | $1,072 | $114,500 | $8,100 | $106,400 |
| 2023 | $823 | $65,400 | $6,300 | $59,100 |
| 2022 | $861 | $65,400 | $6,300 | $59,100 |
| 2021 | $926 | $65,400 | $6,300 | $59,100 |
| 2020 | $909 | $65,400 | $6,300 | $59,100 |
| 2019 | $905 | $56,200 | $6,300 | $49,900 |
| 2018 | $0 | $56,200 | $6,300 | $49,900 |
| 2017 | $0 | $56,200 | $6,300 | $49,900 |
| 2016 | $905 | $56,200 | $6,300 | $49,900 |
| 2015 | $1,275 | $54,000 | $6,300 | $47,700 |
| 2014 | $1,275 | $54,000 | $6,300 | $47,700 |
Source: Public Records
Map
Nearby Homes