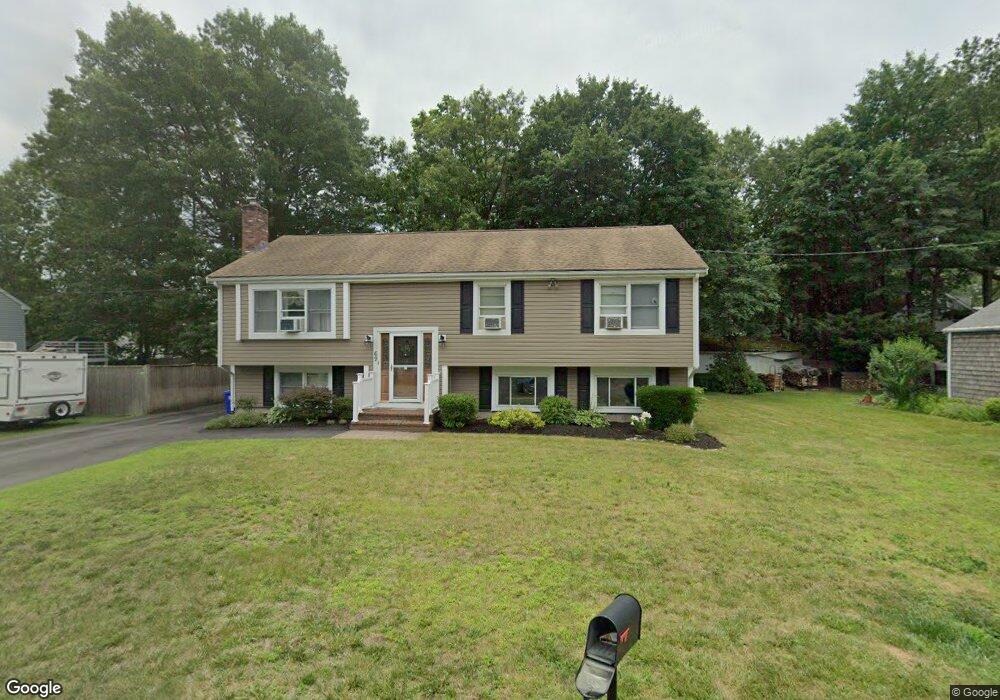
69 Carleton St Attleboro, MA 02703
Estimated Value: $486,000 - $556,000
3
Beds
2
Baths
1,292
Sq Ft
$393/Sq Ft
Est. Value
About This Home
This home is located at 69 Carleton St, Attleboro, MA 02703 and is currently estimated at $508,229, approximately $393 per square foot. 69 Carleton St is a home located in Bristol County with nearby schools including Hill-Roberts Elementary School, Robert J. Coelho Middle School, and Attleboro High School.
Ownership History
Date
Name
Owned For
Owner Type
Purchase Details
Closed on
Aug 4, 1994
Sold by
Desmarais Raymond C
Bought by
Sameja Abbas B and Sameja Zubeda Vb
Current Estimated Value
Home Financials for this Owner
Home Financials are based on the most recent Mortgage that was taken out on this home.
Original Mortgage
$96,000
Interest Rate
8.4%
Mortgage Type
Purchase Money Mortgage
Create a Home Valuation Report for This Property
The Home Valuation Report is an in-depth analysis detailing your home's value as well as a comparison with similar homes in the area
Home Values in the Area
Average Home Value in this Area
Purchase History
| Date | Buyer | Sale Price | Title Company |
|---|---|---|---|
| Sameja Abbas B | $111,000 | -- |
Source: Public Records
Mortgage History
| Date | Status | Borrower | Loan Amount |
|---|---|---|---|
| Closed | Sameja Abbas B | $96,000 |
Source: Public Records
Tax History
| Year | Tax Paid | Tax Assessment Tax Assessment Total Assessment is a certain percentage of the fair market value that is determined by local assessors to be the total taxable value of land and additions on the property. | Land | Improvement |
|---|---|---|---|---|
| 2025 | $5,332 | $424,900 | $124,800 | $300,100 |
| 2024 | $5,312 | $417,300 | $124,800 | $292,500 |
| 2023 | $4,991 | $364,600 | $113,400 | $251,200 |
| 2022 | $4,718 | $326,500 | $108,100 | $218,400 |
| 2021 | $4,375 | $295,600 | $103,900 | $191,700 |
| 2020 | $4,131 | $283,700 | $100,900 | $182,800 |
| 2019 | $3,901 | $275,500 | $98,900 | $176,600 |
| 2018 | $3,724 | $251,300 | $96,000 | $155,300 |
| 2017 | $3,665 | $251,900 | $96,000 | $155,900 |
| 2016 | $3,466 | $233,900 | $94,200 | $139,700 |
| 2015 | $3,422 | $232,600 | $94,200 | $138,400 |
| 2014 | $3,276 | $220,600 | $89,800 | $130,800 |
Source: Public Records
Map
Nearby Homes
- 856 Newport Ave
- 0 Mckay St
- 44 Buffington St
- 39 Slade Ave
- 82 Belair Ave
- 23 Magnolia St Unit 2
- 24 Lynn Dr
- 460 Collins St Unit 6
- 460 Collins St Unit 9
- 195 Brown St
- 54 Baltic St Unit 54
- 52 Baltic St Unit 52
- 56 Baltic St Unit 56
- 56 Liberty Dr
- 18 Newton St
- 50 Pullman Ave Unit A
- 50 Pullman Ave Unit B
- 241 Mendon Rd
- 27 Morse Ave
- 13 Rita Dr
Your Personal Tour Guide
Ask me questions while you tour the home.