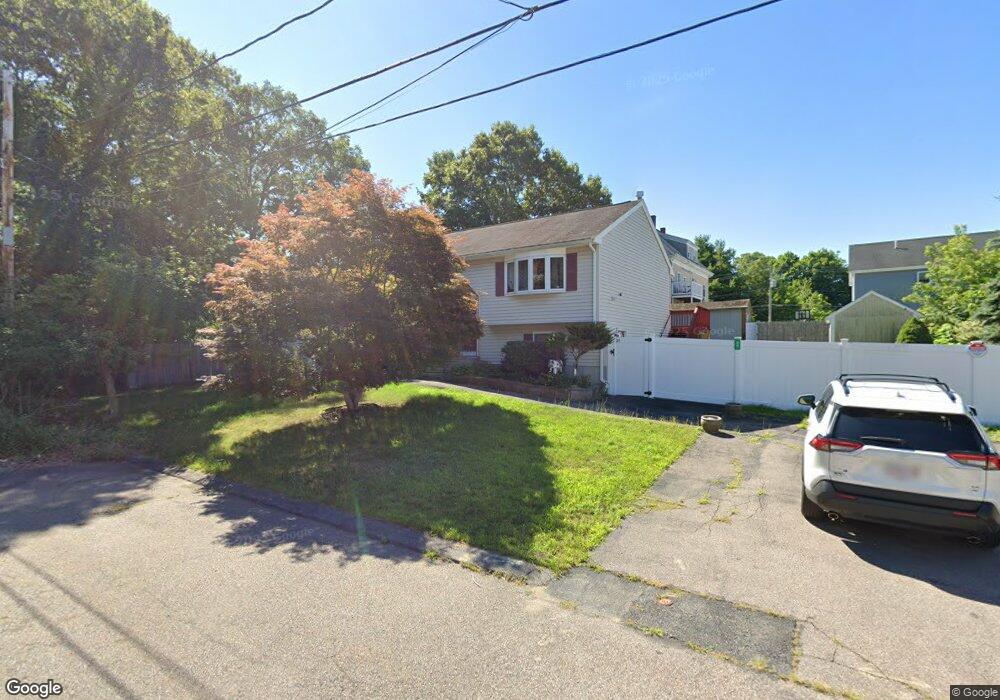
69 Carter St Brockton, MA 02302
Estimated Value: $523,000 - $563,000
3
Beds
1
Bath
1,658
Sq Ft
$325/Sq Ft
Est. Value
About This Home
This home is located at 69 Carter St, Brockton, MA 02302 and is currently estimated at $538,606, approximately $324 per square foot. 69 Carter St is a home located in Plymouth County with nearby schools including Brookfield Elementary School, Mary E. Baker Elementary School, and Downey Elementary School.
Ownership History
Date
Name
Owned For
Owner Type
Purchase Details
Closed on
Apr 20, 1999
Sold by
Colonial Const Co T and Nessralla John C
Bought by
Silv Juan and Silva Catherine
Current Estimated Value
Home Financials for this Owner
Home Financials are based on the most recent Mortgage that was taken out on this home.
Original Mortgage
$95,900
Outstanding Balance
$24,284
Interest Rate
7.04%
Mortgage Type
Purchase Money Mortgage
Estimated Equity
$514,322
Create a Home Valuation Report for This Property
The Home Valuation Report is an in-depth analysis detailing your home's value as well as a comparison with similar homes in the area
Purchase History
| Date | Buyer | Sale Price | Title Company |
|---|---|---|---|
| Silv Juan | $119,900 | -- |
Source: Public Records
Mortgage History
| Date | Status | Borrower | Loan Amount |
|---|---|---|---|
| Open | Silv Juan | $95,900 |
Source: Public Records
Tax History
| Year | Tax Paid | Tax Assessment Tax Assessment Total Assessment is a certain percentage of the fair market value that is determined by local assessors to be the total taxable value of land and additions on the property. | Land | Improvement |
|---|---|---|---|---|
| 2025 | $6,106 | $504,200 | $140,300 | $363,900 |
| 2024 | $5,993 | $498,600 | $140,300 | $358,300 |
| 2023 | $5,541 | $426,900 | $105,400 | $321,500 |
| 2022 | $5,015 | $359,000 | $95,800 | $263,200 |
| 2021 | $4,962 | $342,200 | $79,800 | $262,400 |
| 2020 | $4,784 | $315,800 | $74,500 | $241,300 |
| 2019 | $4,758 | $306,200 | $72,600 | $233,600 |
| 2018 | $4,386 | $273,100 | $72,600 | $200,500 |
| 2017 | $3,978 | $247,100 | $72,600 | $174,500 |
| 2016 | $4,083 | $235,200 | $70,500 | $164,700 |
| 2015 | $4,107 | $226,300 | $70,500 | $155,800 |
| 2014 | $3,949 | $217,800 | $70,500 | $147,300 |
Source: Public Records
Map
Nearby Homes
- 11 Carter St
- 37 Taber Ave
- 14 Emmet St
- 150 E Ashland St
- 136 E Ashland St
- 13 Standish St
- 30 Elliot St
- 29 Hunt St
- 66 Thomas St
- 149 Moncrief St
- 12 Charles St
- 129 Anawan St
- 84 Algonquin St
- 560 N Montello St
- 69 Beacon Park
- 147 Centre St Unit 603
- 39 Huntington St
- 7 Main St Unit 203
- 7 Main St Unit 102
- 58 Budd Ave
Your Personal Tour Guide
Ask me questions while you tour the home.