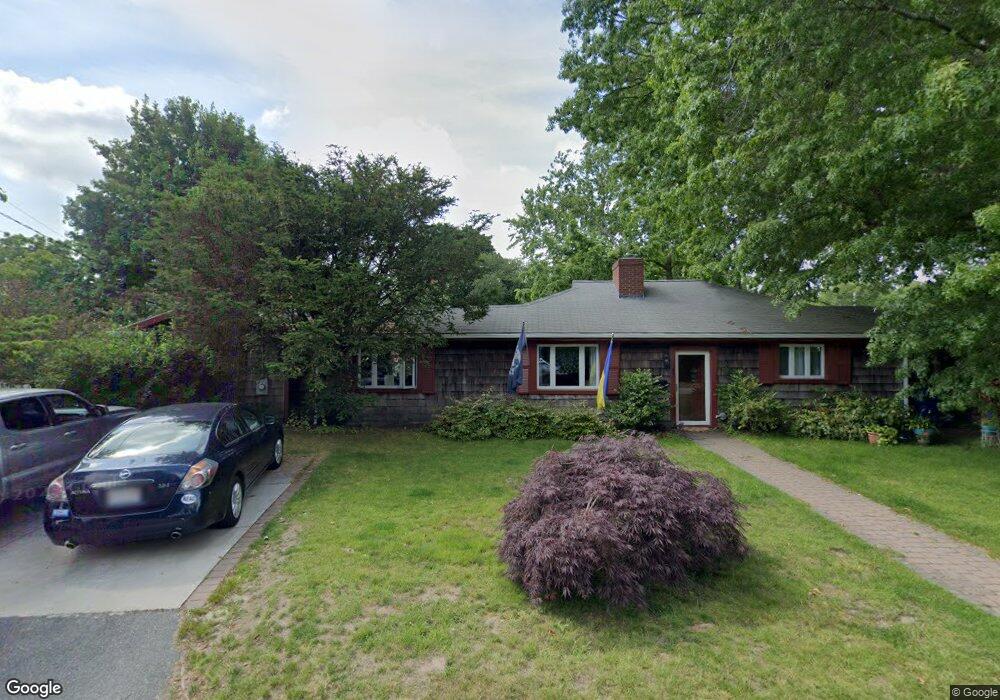
69 Cedar St Fairhaven, MA 02719
Estimated Value: $509,000 - $871,000
4
Beds
2
Baths
2,403
Sq Ft
$282/Sq Ft
Est. Value
About This Home
This home is located at 69 Cedar St, Fairhaven, MA 02719 and is currently estimated at $676,547, approximately $281 per square foot. 69 Cedar St is a home located in Bristol County with nearby schools including Fairhaven High School, City On A Hill Charter Public School New Bedford, and St. Joseph School.
Ownership History
Date
Name
Owned For
Owner Type
Purchase Details
Closed on
Mar 3, 2022
Sold by
Kelly James J and Kelly Julianne
Bought by
Kelly James J and Kelly Julianne
Current Estimated Value
Home Financials for this Owner
Home Financials are based on the most recent Mortgage that was taken out on this home.
Original Mortgage
$177,000
Outstanding Balance
$142,360
Interest Rate
2.93%
Mortgage Type
Stand Alone Refi Refinance Of Original Loan
Estimated Equity
$534,187
Purchase Details
Closed on
Jun 10, 1977
Bought by
Kelly James J and Kelly Julianne
Create a Home Valuation Report for This Property
The Home Valuation Report is an in-depth analysis detailing your home's value as well as a comparison with similar homes in the area
Home Values in the Area
Average Home Value in this Area
Purchase History
| Date | Buyer | Sale Price | Title Company |
|---|---|---|---|
| Kelly James J | -- | None Available | |
| Kelly James J | -- | None Available | |
| Kelly James J | $36,000 | -- |
Source: Public Records
Mortgage History
| Date | Status | Borrower | Loan Amount |
|---|---|---|---|
| Open | Kelly James J | $177,000 | |
| Closed | Kelly James J | $177,000 | |
| Previous Owner | Kelly James J | $70,000 |
Source: Public Records
Tax History Compared to Growth
Tax History
| Year | Tax Paid | Tax Assessment Tax Assessment Total Assessment is a certain percentage of the fair market value that is determined by local assessors to be the total taxable value of land and additions on the property. | Land | Improvement |
|---|---|---|---|---|
| 2025 | $42 | $448,300 | $182,800 | $265,500 |
| 2024 | $3,917 | $424,400 | $182,800 | $241,600 |
| 2023 | $3,737 | $375,600 | $160,600 | $215,000 |
| 2022 | $3,621 | $354,300 | $149,500 | $204,800 |
| 2021 | $3,413 | $302,300 | $135,600 | $166,700 |
| 2020 | $3,343 | $302,300 | $135,600 | $166,700 |
| 2019 | $3,208 | $274,900 | $113,100 | $161,800 |
| 2018 | $3,032 | $258,000 | $107,900 | $150,100 |
| 2017 | $2,969 | $246,600 | $107,900 | $138,700 |
| 2016 | $2,917 | $239,500 | $107,900 | $131,600 |
| 2015 | $2,865 | $235,800 | $107,900 | $127,900 |
Source: Public Records
Map
Nearby Homes