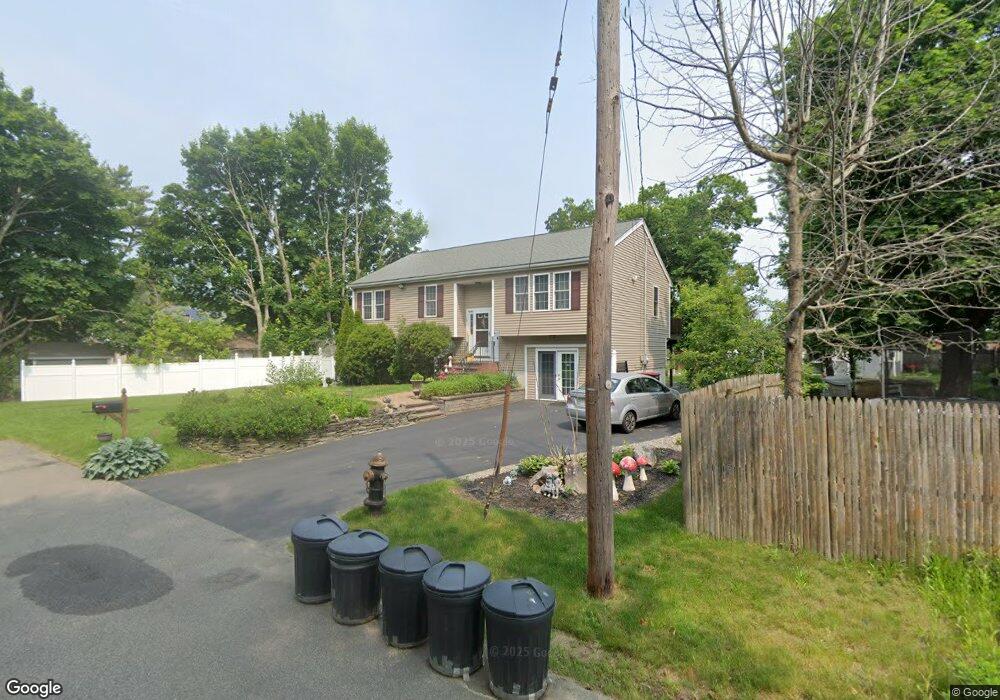
69 Central St Brockton, MA 02301
Clifton Heights NeighborhoodEstimated Value: $555,000 - $610,000
4
Beds
3
Baths
1,820
Sq Ft
$322/Sq Ft
Est. Value
About This Home
This home is located at 69 Central St, Brockton, MA 02301 and is currently estimated at $586,374, approximately $322 per square foot. 69 Central St is a home located in Plymouth County with nearby schools including Gilmore Elementary School, John F. Kennedy Elementary School, and Davis K-8 School.
Ownership History
Date
Name
Owned For
Owner Type
Purchase Details
Closed on
Feb 11, 2021
Sold by
Borges Oscar J
Bought by
Oj Borges Ft and Borges
Current Estimated Value
Purchase Details
Closed on
Dec 10, 2020
Sold by
Borges Oscar J and Borges Artemisa
Bought by
Borges Oscar J
Home Financials for this Owner
Home Financials are based on the most recent Mortgage that was taken out on this home.
Original Mortgage
$278,000
Interest Rate
2.8%
Mortgage Type
New Conventional
Purchase Details
Closed on
Apr 17, 2007
Sold by
Briarwood Constr Corp
Bought by
Borges Oscar J and Teixeira Artemisa
Home Financials for this Owner
Home Financials are based on the most recent Mortgage that was taken out on this home.
Original Mortgage
$247,425
Interest Rate
6.24%
Mortgage Type
Purchase Money Mortgage
Create a Home Valuation Report for This Property
The Home Valuation Report is an in-depth analysis detailing your home's value as well as a comparison with similar homes in the area
Home Values in the Area
Average Home Value in this Area
Purchase History
| Date | Buyer | Sale Price | Title Company |
|---|---|---|---|
| Oj Borges Ft | -- | None Available | |
| Borges Oscar J | -- | None Available | |
| Borges Oscar J | $329,900 | -- |
Source: Public Records
Mortgage History
| Date | Status | Borrower | Loan Amount |
|---|---|---|---|
| Previous Owner | Borges Oscar J | $278,000 | |
| Previous Owner | Borges Oscar J | $232,500 | |
| Previous Owner | Borges Oscar J | $247,425 | |
| Previous Owner | Borges Oscar J | $49,485 | |
| Previous Owner | Borges Oscar J | $240,000 |
Source: Public Records
Tax History
| Year | Tax Paid | Tax Assessment Tax Assessment Total Assessment is a certain percentage of the fair market value that is determined by local assessors to be the total taxable value of land and additions on the property. | Land | Improvement |
|---|---|---|---|---|
| 2025 | $6,346 | $524,000 | $144,800 | $379,200 |
| 2024 | $6,002 | $499,300 | $144,800 | $354,500 |
| 2023 | $5,654 | $435,600 | $109,800 | $325,800 |
| 2022 | $5,705 | $408,400 | $99,800 | $308,600 |
| 2021 | $5,275 | $363,800 | $94,400 | $269,400 |
| 2020 | $5,213 | $344,100 | $90,400 | $253,700 |
| 2019 | $4,538 | $292,000 | $84,800 | $207,200 |
| 2018 | $4,081 | $261,400 | $84,800 | $176,600 |
| 2017 | $4,081 | $253,500 | $84,800 | $168,700 |
| 2016 | $4,314 | $248,500 | $76,700 | $171,800 |
| 2015 | $4,073 | $224,400 | $76,700 | $147,700 |
| 2014 | $4,083 | $225,200 | $76,700 | $148,500 |
Source: Public Records
Map
Nearby Homes
Your Personal Tour Guide
Ask me questions while you tour the home.