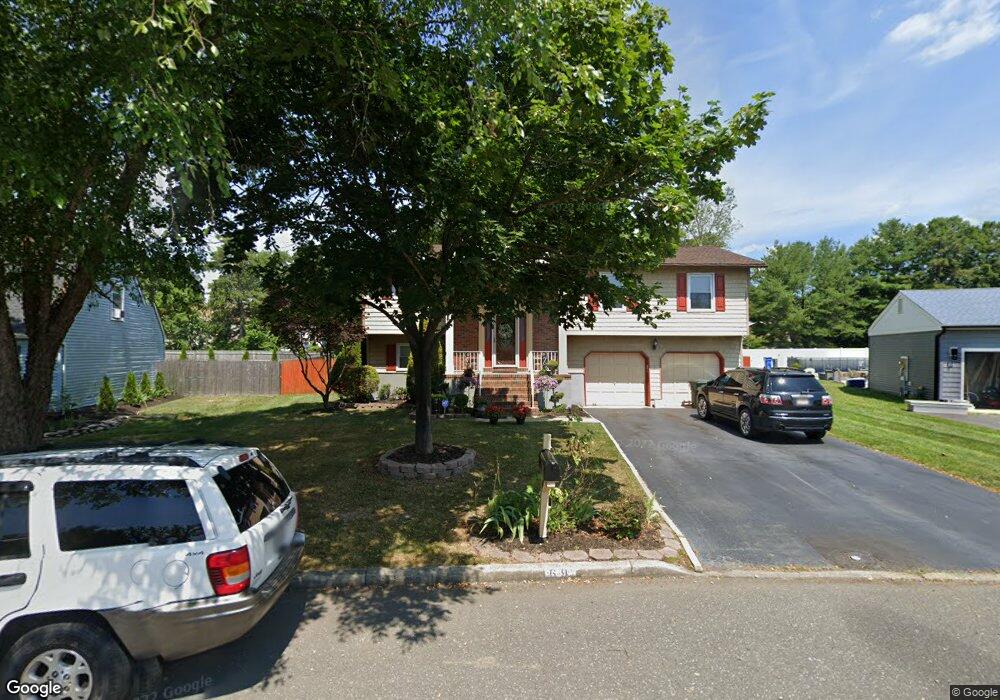
69 Charles Dr Tinton Falls, NJ 07753
Estimated Value: $699,000 - $746,000
4
Beds
3
Baths
2,004
Sq Ft
$357/Sq Ft
Est. Value
About This Home
This home is located at 69 Charles Dr, Tinton Falls, NJ 07753 and is currently estimated at $715,661, approximately $357 per square foot. 69 Charles Dr is a home located in Monmouth County with nearby schools including Mahala F. Atchinson Elementary School, Swimming River Elementary School, and Tinton Falls Middle School.
Ownership History
Date
Name
Owned For
Owner Type
Purchase Details
Closed on
Dec 27, 2001
Sold by
Rivard Jean
Bought by
Lawrence John and Lawrence Gwendolyn
Current Estimated Value
Home Financials for this Owner
Home Financials are based on the most recent Mortgage that was taken out on this home.
Original Mortgage
$215,900
Interest Rate
7.08%
Purchase Details
Closed on
Jul 24, 1998
Sold by
Bierly Paul
Bought by
Rivard Jean and Rivard Mary
Home Financials for this Owner
Home Financials are based on the most recent Mortgage that was taken out on this home.
Original Mortgage
$144,000
Interest Rate
6.9%
Purchase Details
Closed on
Jun 30, 1994
Sold by
Sparaco Anne Marie
Bought by
Mccabe Paul and Mc Cabe Hilary
Home Financials for this Owner
Home Financials are based on the most recent Mortgage that was taken out on this home.
Original Mortgage
$120,000
Interest Rate
8.51%
Create a Home Valuation Report for This Property
The Home Valuation Report is an in-depth analysis detailing your home's value as well as a comparison with similar homes in the area
Home Values in the Area
Average Home Value in this Area
Purchase History
| Date | Buyer | Sale Price | Title Company |
|---|---|---|---|
| Lawrence John | $269,900 | -- | |
| Rivard Jean | $180,000 | -- | |
| Mccabe Paul | $175,000 | -- |
Source: Public Records
Mortgage History
| Date | Status | Borrower | Loan Amount |
|---|---|---|---|
| Previous Owner | Lawrence John | $215,900 | |
| Previous Owner | Rivard Jean | $144,000 | |
| Previous Owner | Mccabe Paul | $120,000 |
Source: Public Records
Tax History Compared to Growth
Tax History
| Year | Tax Paid | Tax Assessment Tax Assessment Total Assessment is a certain percentage of the fair market value that is determined by local assessors to be the total taxable value of land and additions on the property. | Land | Improvement |
|---|---|---|---|---|
| 2025 | $8,722 | $651,200 | $329,500 | $321,700 |
| 2024 | $7,863 | $606,100 | $291,700 | $314,400 |
| 2023 | $7,863 | $515,300 | $229,300 | $286,000 |
| 2022 | $8,026 | $478,000 | $205,600 | $272,400 |
| 2021 | $7,858 | $416,700 | $198,200 | $218,500 |
| 2020 | $7,703 | $386,100 | $155,400 | $230,700 |
| 2019 | $7,858 | $394,500 | $165,200 | $229,300 |
| 2018 | $7,714 | $386,100 | $167,400 | $218,700 |
| 2017 | $7,637 | $372,700 | $160,600 | $212,100 |
| 2016 | $7,977 | $380,600 | $173,900 | $206,700 |
| 2015 | $7,769 | $375,300 | $173,900 | $201,400 |
| 2014 | $7,306 | $337,600 | $122,700 | $214,900 |
Source: Public Records
Map
Nearby Homes