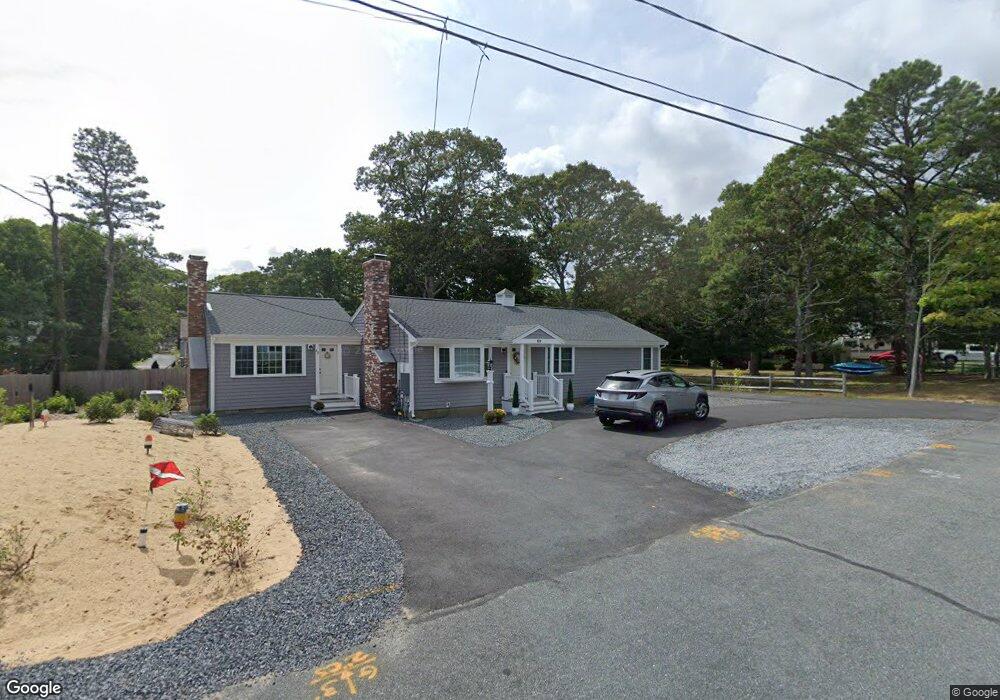
69 Charles St Unit St South Dennis, MA 02660
South Dennis NeighborhoodEstimated Value: $596,000 - $712,000
4
Beds
2
Baths
1,542
Sq Ft
$415/Sq Ft
Est. Value
About This Home
This home is located at 69 Charles St Unit St, South Dennis, MA 02660 and is currently estimated at $640,309, approximately $415 per square foot. 69 Charles St Unit St is a home located in Barnstable County with nearby schools including Dennis-Yarmouth Regional High School and St. Pius X. School.
Ownership History
Date
Name
Owned For
Owner Type
Purchase Details
Closed on
Sep 12, 2008
Sold by
Mcguinness-Rossi Jean
Bought by
Mcguinness-Rossi Jean and Mcguinness-Rossi Kevin E
Current Estimated Value
Purchase Details
Closed on
Jun 12, 1996
Sold by
Sullivan John S and Sullivan Angela G
Bought by
Mcguinness Adelaide H and Rossi Jean M
Create a Home Valuation Report for This Property
The Home Valuation Report is an in-depth analysis detailing your home's value as well as a comparison with similar homes in the area
Home Values in the Area
Average Home Value in this Area
Purchase History
| Date | Buyer | Sale Price | Title Company |
|---|---|---|---|
| Mcguinness-Rossi Jean | -- | -- | |
| Mcguinness-Rossi Jean | -- | -- | |
| Mcguinness Adelaide H | $105,000 | -- |
Source: Public Records
Mortgage History
| Date | Status | Borrower | Loan Amount |
|---|---|---|---|
| Open | Mcguinness Adelaide H | $185,000 | |
| Closed | Mcguinness Adelaide H | $185,000 | |
| Previous Owner | Mcguinness Adelaide H | $50,000 |
Source: Public Records
Tax History Compared to Growth
Tax History
| Year | Tax Paid | Tax Assessment Tax Assessment Total Assessment is a certain percentage of the fair market value that is determined by local assessors to be the total taxable value of land and additions on the property. | Land | Improvement |
|---|---|---|---|---|
| 2025 | $2,590 | $598,200 | $134,500 | $463,700 |
| 2024 | $2,363 | $538,300 | $129,300 | $409,000 |
| 2023 | $2,285 | $489,400 | $117,500 | $371,900 |
| 2022 | $2,197 | $392,300 | $117,700 | $274,600 |
| 2021 | $2,083 | $345,500 | $115,300 | $230,200 |
| 2020 | $1,977 | $324,100 | $115,300 | $208,800 |
| 2019 | $1,911 | $309,800 | $124,400 | $185,400 |
| 2018 | $1,737 | $274,000 | $107,700 | $166,300 |
| 2017 | $1,652 | $268,600 | $107,700 | $160,900 |
| 2016 | $1,473 | $225,600 | $113,000 | $112,600 |
| 2015 | $1,444 | $225,600 | $113,000 | $112,600 |
| 2014 | $1,553 | $244,500 | $96,900 | $147,600 |
Source: Public Records
Map
Nearby Homes
- 52 Uncle Bobs Way
- 153 Bayridge Dr
- 17 Margate Ln
- 4 Ebb Rd
- 17 Fairmount Rd
- 10 Joanne Dr
- 17 Fairmount Rd
- 118 Driftwood Ln
- 13 Covey Dr
- 25 Skerry Rd
- 241 Old Bass River Rd
- 7 Vinland Dr
- 129 Driftwood Ln
- 111 Merchant Ave
- 1 Norseman Dr
- 40 Viking Dr
- 62 Old Fish House Rd
- 6 Hawthorn St
- 32 Captain Walsh Dr
- 6 Nimble Hill Dr