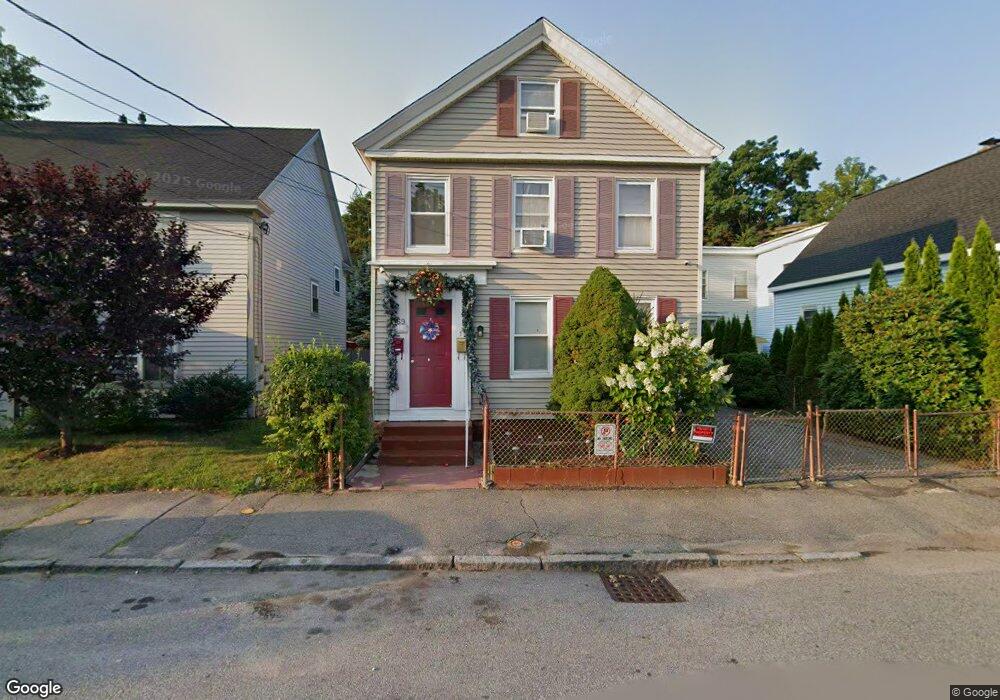
69 Chestnut St Lowell, MA 01852
Lower Belvidere NeighborhoodEstimated Value: $533,852 - $710,000
5
Beds
2
Baths
2,526
Sq Ft
$242/Sq Ft
Est. Value
About This Home
This home is located at 69 Chestnut St, Lowell, MA 01852 and is currently estimated at $611,213, approximately $241 per square foot. 69 Chestnut St is a home located in Middlesex County with nearby schools including Moody Elementary School, Abraham Lincoln Elementary School, and Greenhalge Elementary School.
Ownership History
Date
Name
Owned For
Owner Type
Purchase Details
Closed on
Sep 24, 1993
Sold by
Jjt Nt and Carroll Joseph E
Bought by
Clarke Winston F
Current Estimated Value
Home Financials for this Owner
Home Financials are based on the most recent Mortgage that was taken out on this home.
Original Mortgage
$38,700
Interest Rate
7.1%
Mortgage Type
Purchase Money Mortgage
Create a Home Valuation Report for This Property
The Home Valuation Report is an in-depth analysis detailing your home's value as well as a comparison with similar homes in the area
Home Values in the Area
Average Home Value in this Area
Purchase History
| Date | Buyer | Sale Price | Title Company |
|---|---|---|---|
| Clarke Winston F | $43,000 | -- | |
| Clarke Winston F | $43,000 | -- |
Source: Public Records
Mortgage History
| Date | Status | Borrower | Loan Amount |
|---|---|---|---|
| Open | Clarke Winston F | $20,000 | |
| Closed | Clarke Winston F | $7,248 | |
| Closed | Clarke Winston F | $38,700 |
Source: Public Records
Tax History Compared to Growth
Tax History
| Year | Tax Paid | Tax Assessment Tax Assessment Total Assessment is a certain percentage of the fair market value that is determined by local assessors to be the total taxable value of land and additions on the property. | Land | Improvement |
|---|---|---|---|---|
| 2025 | $5,708 | $497,200 | $117,600 | $379,600 |
| 2024 | $5,370 | $450,900 | $115,200 | $335,700 |
| 2023 | $4,993 | $402,000 | $100,100 | $301,900 |
| 2022 | $4,480 | $353,000 | $79,700 | $273,300 |
| 2021 | $4,123 | $306,300 | $69,300 | $237,000 |
| 2020 | $3,881 | $290,500 | $72,000 | $218,500 |
| 2019 | $3,722 | $265,100 | $71,600 | $193,500 |
| 2018 | $3,474 | $241,400 | $68,200 | $173,200 |
| 2017 | $3,282 | $220,000 | $62,000 | $158,000 |
| 2016 | $3,238 | $213,600 | $55,600 | $158,000 |
| 2015 | $2,994 | $193,400 | $55,600 | $137,800 |
| 2013 | $2,726 | $181,600 | $64,300 | $117,300 |
Source: Public Records
Map
Nearby Homes
- 158 Concord St
- 112 Fort Hill Ave
- 318 Andover St
- 39 Groves Ave
- 17 Kearney Square Unit 201
- 17 Kearney Square Unit 205
- 216 Nesmith St Unit 2
- 80 Rogers St Unit 204
- 80 Rogers St Unit 304
- 192 1st St
- 53 Fairmount St
- 8 Read St
- 8 Clarks Ct
- 94 1st St Unit 10
- 44 Hanks St
- 23-33 Middle St Unit 11
- 23-33 Middle St Unit 6
- 23-33 Middle St Unit 17
- 21 Vernon St
- 61 Market St Unit 2B