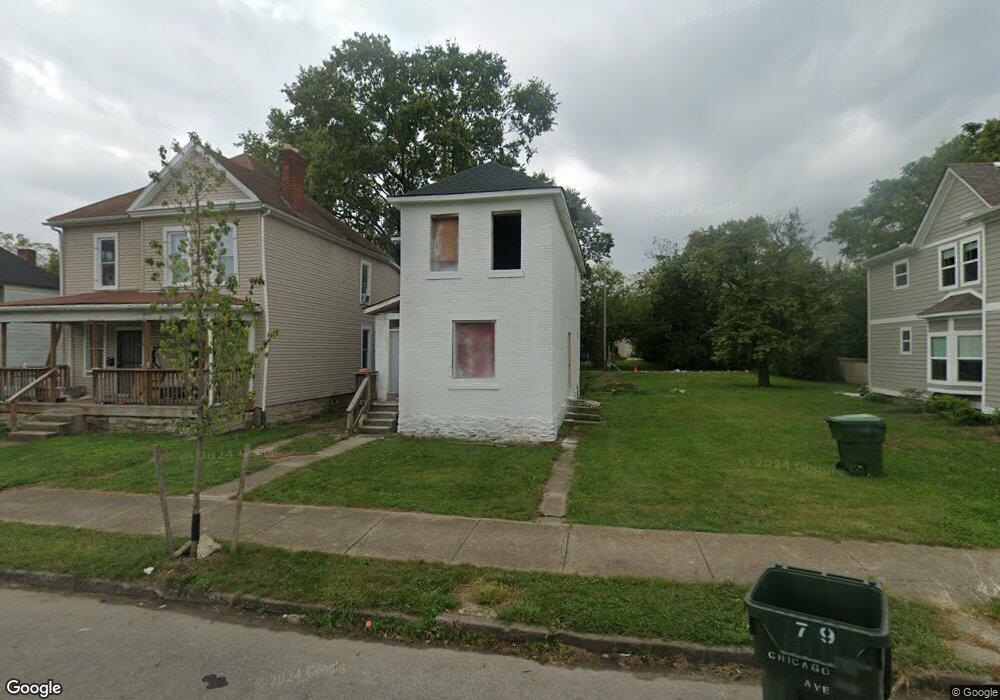
69 Chicago Ave Unit 69 1/2 Columbus, OH 43222
Franklinton NeighborhoodEstimated Value: $183,000 - $351,000
4
Beds
2
Baths
1,554
Sq Ft
$175/Sq Ft
Est. Value
About This Home
This home is located at 69 Chicago Ave Unit 69 1/2, Columbus, OH 43222 and is currently estimated at $272,330, approximately $175 per square foot. 69 Chicago Ave Unit 69 1/2 is a home located in Franklin County with nearby schools including Starling PK-8, Avondale Elementary School, and West High School.
Ownership History
Date
Name
Owned For
Owner Type
Purchase Details
Closed on
Dec 12, 2018
Sold by
Maximum Development Llc
Bought by
Powell Realty Inv Llc
Current Estimated Value
Purchase Details
Closed on
Jun 26, 2017
Sold by
Ortiz Victor
Bought by
Maximum Development Llc
Purchase Details
Closed on
Sep 23, 2015
Sold by
Figueroa Ethel L and Fiqueroa Ethal L
Bought by
Ortiz Victor
Purchase Details
Closed on
Jun 14, 2013
Sold by
Sufi Munye Suldanheidar
Bought by
Fiqueroa Ethel L
Purchase Details
Closed on
Mar 21, 2013
Sold by
Abukar Ali
Bought by
Munye Suldanheidar Sufi
Purchase Details
Closed on
Dec 7, 2009
Sold by
Reeves Kathary David W and Reeves Kathary Carol
Bought by
Abukar Ali
Purchase Details
Closed on
Feb 6, 1992
Purchase Details
Closed on
Feb 20, 1990
Create a Home Valuation Report for This Property
The Home Valuation Report is an in-depth analysis detailing your home's value as well as a comparison with similar homes in the area
Home Values in the Area
Average Home Value in this Area
Purchase History
| Date | Buyer | Sale Price | Title Company |
|---|---|---|---|
| Powell Realty Inv Llc | $55,000 | Signature Title Agency Inc | |
| Maximum Development Llc | $700,000 | Atlas Title Solutions | |
| Ortiz Victor | $5,000 | None Available | |
| Fiqueroa Ethel L | $4,000 | Quality Choice Title Box | |
| Munye Suldanheidar Sufi | $18,800 | None Available | |
| Abukar Ali | $3,000 | Fati | |
| -- | $18,500 | -- | |
| -- | $20,000 | -- |
Source: Public Records
Tax History Compared to Growth
Tax History
| Year | Tax Paid | Tax Assessment Tax Assessment Total Assessment is a certain percentage of the fair market value that is determined by local assessors to be the total taxable value of land and additions on the property. | Land | Improvement |
|---|---|---|---|---|
| 2024 | $2,334 | $50,930 | $6,300 | $44,630 |
| 2023 | $1,873 | $41,055 | $6,300 | $34,755 |
| 2022 | $761 | $14,320 | $1,230 | $13,090 |
| 2021 | $762 | $14,320 | $1,230 | $13,090 |
| 2020 | $764 | $14,320 | $1,230 | $13,090 |
| 2019 | $892 | $11,940 | $1,020 | $10,920 |
| 2018 | $165 | $3,020 | $1,300 | $1,720 |
| 2017 | $216 | $3,020 | $1,300 | $1,720 |
| 2016 | $245 | $1,410 | $1,230 | $180 |
| 2015 | $142 | $1,410 | $1,230 | $180 |
| 2014 | $87 | $1,410 | $1,230 | $180 |
| 2013 | $388 | $6,580 | $1,645 | $4,935 |
Source: Public Records
Map
Nearby Homes
- 69-69.5 Chicago Ave
- 48 N Princeton Ave
- 40 Hayden Ave
- 32 Hayden Ave
- 137 Wisconsin Ave
- 63 Hayden Ave
- 142 Wisconsin Ave
- 55 Hayden Ave
- 33 S Princeton Ave
- 52 N Yale Ave
- 49 S Yale Ave
- 87 S Princeton Ave
- 55 Brehl Ave
- 143 N Central Ave
- 1340-1342 W State St
- 117 Dana Ave
- 1073 Cable Ave
- 77 N Guilford Ave
- 57 N Guilford Ave
- 139 S Princeton Ave
- 69 Chicago Ave
- 63 Chicago Ave
- 75 Chicago Ave Unit 77
- 75-77 Chicago Ave
- 79 Chicago Ave
- 59 Chicago Ave
- 81 Chicago Ave
- 55 Chicago Ave
- 53 Chicago Ave
- 83 Chicago Ave Unit 85
- 83-85 Chicago Ave
- 85 Chicago Ave
- 76 Chicago Ave
- 89 Chicago Ave
- 68 N Princeton Ave
- 66 N Princeton Ave
- 72 N Princeton Ave
- 62 N Princeton Ave
- 0 N Princeton Ave
- 43 Chicago Ave