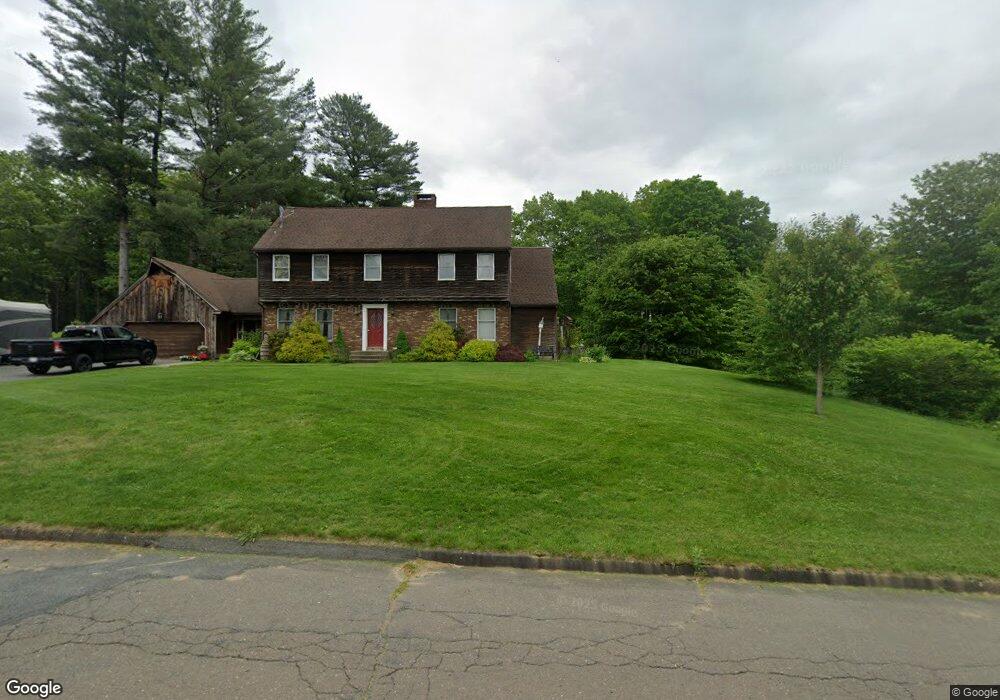
69 City View Blvd Westfield, MA 01085
Estimated Value: $397,000 - $514,000
3
Beds
3
Baths
1,504
Sq Ft
$300/Sq Ft
Est. Value
About This Home
This home is located at 69 City View Blvd, Westfield, MA 01085 and is currently estimated at $450,952, approximately $299 per square foot. 69 City View Blvd is a home located in Hampden County with nearby schools including Westfield High School and Saint Mary High School.
Ownership History
Date
Name
Owned For
Owner Type
Purchase Details
Closed on
Jun 15, 1994
Sold by
Margaret Liptak T
Bought by
Disanto Jonathan and Disanto Mary A S
Current Estimated Value
Home Financials for this Owner
Home Financials are based on the most recent Mortgage that was taken out on this home.
Original Mortgage
$120,800
Interest Rate
8.5%
Mortgage Type
Purchase Money Mortgage
Create a Home Valuation Report for This Property
The Home Valuation Report is an in-depth analysis detailing your home's value as well as a comparison with similar homes in the area
Home Values in the Area
Average Home Value in this Area
Purchase History
| Date | Buyer | Sale Price | Title Company |
|---|---|---|---|
| Disanto Jonathan | $151,000 | -- |
Source: Public Records
Mortgage History
| Date | Status | Borrower | Loan Amount |
|---|---|---|---|
| Open | Disanto Jonathan | $149,400 | |
| Closed | Disanto Jonathan | $116,000 | |
| Closed | Disanto Jonathan | $120,800 |
Source: Public Records
Tax History Compared to Growth
Tax History
| Year | Tax Paid | Tax Assessment Tax Assessment Total Assessment is a certain percentage of the fair market value that is determined by local assessors to be the total taxable value of land and additions on the property. | Land | Improvement |
|---|---|---|---|---|
| 2025 | $5,450 | $359,000 | $142,400 | $216,600 |
| 2024 | $5,538 | $346,800 | $130,200 | $216,600 |
| 2023 | $5,192 | $317,100 | $124,000 | $193,100 |
| 2022 | $5,192 | $280,800 | $110,500 | $170,300 |
| 2021 | $5,033 | $266,600 | $104,400 | $162,200 |
| 2020 | $5,017 | $260,600 | $104,400 | $156,200 |
| 2019 | $4,906 | $249,400 | $99,600 | $149,800 |
| 2018 | $4,828 | $249,400 | $99,600 | $149,800 |
| 2017 | $4,595 | $236,600 | $100,900 | $135,700 |
| 2016 | $4,600 | $236,600 | $100,900 | $135,700 |
| 2015 | $4,587 | $247,400 | $100,900 | $146,500 |
| 2014 | $3,432 | $247,400 | $100,900 | $146,500 |
Source: Public Records
Map
Nearby Homes
- 0 Fox Hill Dr
- 53 Yankee Cir
- 508 Granville Rd
- 197 Loomis Rg
- 78 Granville Rd Unit 11
- 40 Heritage Ln
- 11 Highland Cir
- 128 Crane Ave
- 172 Valley View Dr
- 324 Russell Rd Unit 204
- 444 Loomis St
- 205 Russell Rd
- 386 Hillside Rd
- 549 Russell Rd Unit 6B
- 555 Russell Rd Unit D18
- 69 Beveridge Blvd
- 82 S Maple St Unit 43
- 82 S Maple St Unit 11
- 74 S Maple St
- 70 S Maple St
- 75 City View Blvd
- 36 Fox Hill Dr
- 32 Fox Hill Dr
- 28 Fox Hill Dr
- 89 City View Blvd
- 61 Yankee Cir
- 24 Fox Hill Dr
- 29 Fox Hill Dr
- 83 Whitaker Rd
- 57 Yankee Cir
- 20 Fox Hill Dr
- 77 Whitaker Rd
- 56 Yankee Cir
- 71 Whitaker Rd
- 25 Fox Hill Dr
- 65 Whitaker Rd
- 97 Whitaker Rd
- Lot 3 Whitaker Rd
- 85 City View Blvd
- 73 City View Blvd