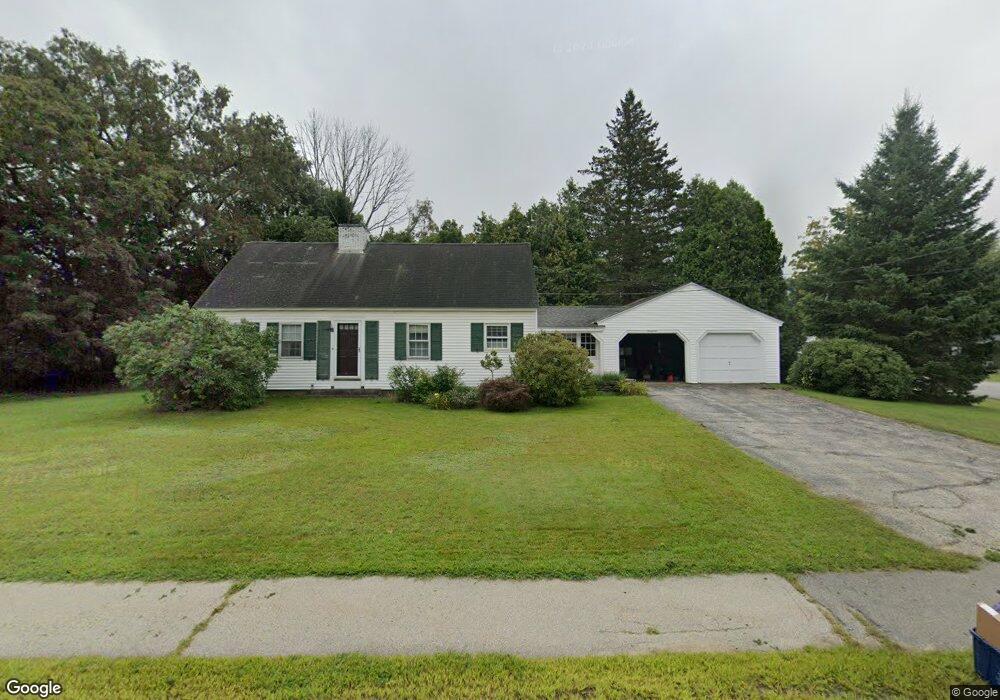
69 Clinton St Concord, NH 03301
South End NeighborhoodEstimated Value: $489,388 - $552,000
3
Beds
2
Baths
1,755
Sq Ft
$299/Sq Ft
Est. Value
About This Home
This home is located at 69 Clinton St, Concord, NH 03301 and is currently estimated at $524,097, approximately $298 per square foot. 69 Clinton St is a home located in Merrimack County with nearby schools including Abbot-Downing School, Rundlett Middle School, and Concord High School.
Ownership History
Date
Name
Owned For
Owner Type
Purchase Details
Closed on
Apr 21, 1997
Sold by
Sara R Black 1992 Tr
Bought by
Sulliva Eugene Francis and Sullivan Ruth A
Current Estimated Value
Home Financials for this Owner
Home Financials are based on the most recent Mortgage that was taken out on this home.
Original Mortgage
$85,000
Outstanding Balance
$8,687
Interest Rate
7.76%
Mortgage Type
Purchase Money Mortgage
Estimated Equity
$515,410
Create a Home Valuation Report for This Property
The Home Valuation Report is an in-depth analysis detailing your home's value as well as a comparison with similar homes in the area
Home Values in the Area
Average Home Value in this Area
Purchase History
We collect this data history from publicly available records. To have your information removed, we recommend requesting removal directly through your county’s website.
| Date | Buyer | Sale Price | Title Company |
|---|---|---|---|
| Sulliva Eugene Francis | $106,500 | -- |
Source: Public Records
Mortgage History
We collect this data history from publicly available records. To have your information removed, we recommend requesting removal directly through your county’s website.
| Date | Status | Borrower | Loan Amount |
|---|---|---|---|
| Open | Sulliva Eugene Francis | $85,000 |
Source: Public Records
Tax History
| Year | Tax Paid | Tax Assessment Tax Assessment Total Assessment is a certain percentage of the fair market value that is determined by local assessors to be the total taxable value of land and additions on the property. | Land | Improvement |
|---|---|---|---|---|
| 2025 | $10,142 | $348,400 | $114,800 | $233,600 |
| 2024 | $9,647 | $348,400 | $114,800 | $233,600 |
| 2023 | $9,358 | $348,400 | $114,800 | $233,600 |
| 2022 | $9,020 | $348,400 | $114,800 | $233,600 |
| 2021 | $8,752 | $348,400 | $114,800 | $233,600 |
| 2020 | $8,526 | $318,600 | $91,700 | $226,900 |
| 2019 | $7,820 | $281,500 | $87,700 | $193,800 |
| 2018 | $7,482 | $265,400 | $84,300 | $181,100 |
| 2017 | $7,266 | $257,300 | $84,300 | $173,000 |
| 2016 | $6,829 | $246,800 | $82,700 | $164,100 |
| 2015 | $6,559 | $237,100 | $89,700 | $147,400 |
| 2014 | $6,357 | $237,100 | $89,700 | $147,400 |
| 2013 | -- | $234,300 | $89,700 | $144,600 |
| 2012 | -- | $228,300 | $89,700 | $138,600 |
Source: Public Records
Map
Nearby Homes
Your Personal Tour Guide
Ask me questions while you tour the home.