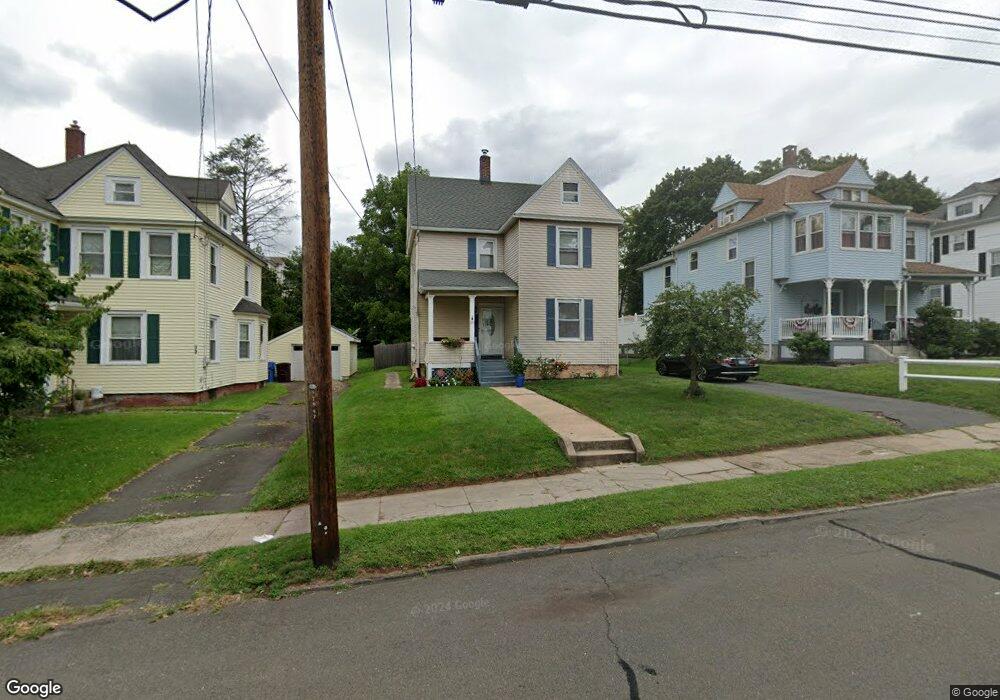
69 Columbia St New Britain, CT 06052
Estimated Value: $283,449 - $295,000
3
Beds
2
Baths
1,353
Sq Ft
$212/Sq Ft
Est. Value
About This Home
This home is located at 69 Columbia St, New Britain, CT 06052 and is currently estimated at $287,112, approximately $212 per square foot. 69 Columbia St is a home located in Hartford County with nearby schools including Vance School, Slade Middle School, and Raymond Hill School.
Ownership History
Date
Name
Owned For
Owner Type
Purchase Details
Closed on
Aug 1, 2005
Sold by
Ezedine William
Bought by
Wills Stephanie
Current Estimated Value
Home Financials for this Owner
Home Financials are based on the most recent Mortgage that was taken out on this home.
Original Mortgage
$163,200
Outstanding Balance
$85,786
Interest Rate
5.67%
Estimated Equity
$201,326
Purchase Details
Closed on
May 28, 1997
Sold by
Anderson Robert D and Anderson Dianne
Bought by
Bagley Mike A and Bagley Cindy L
Purchase Details
Closed on
Jun 17, 1988
Sold by
Nyquist Charles J
Bought by
Anderson Robert D
Create a Home Valuation Report for This Property
The Home Valuation Report is an in-depth analysis detailing your home's value as well as a comparison with similar homes in the area
Home Values in the Area
Average Home Value in this Area
Purchase History
| Date | Buyer | Sale Price | Title Company |
|---|---|---|---|
| Wills Stephanie | $164,500 | -- | |
| Bagley Mike A | $77,000 | -- | |
| Anderson Robert D | $129,000 | -- |
Source: Public Records
Mortgage History
| Date | Status | Borrower | Loan Amount |
|---|---|---|---|
| Open | Anderson Robert D | $163,200 | |
| Closed | Anderson Robert D | $8,500 | |
| Previous Owner | Anderson Robert D | $106,200 |
Source: Public Records
Tax History Compared to Growth
Tax History
| Year | Tax Paid | Tax Assessment Tax Assessment Total Assessment is a certain percentage of the fair market value that is determined by local assessors to be the total taxable value of land and additions on the property. | Land | Improvement |
|---|---|---|---|---|
| 2025 | $4,898 | $125,020 | $46,270 | $78,750 |
| 2024 | $4,950 | $125,020 | $46,270 | $78,750 |
| 2023 | $4,786 | $125,020 | $46,270 | $78,750 |
| 2022 | $4,044 | $81,690 | $21,280 | $60,410 |
| 2021 | $4,044 | $81,690 | $21,280 | $60,410 |
| 2020 | $4,125 | $81,690 | $21,280 | $60,410 |
| 2019 | $4,125 | $81,690 | $21,280 | $60,410 |
| 2018 | $4,125 | $81,690 | $21,280 | $60,410 |
| 2017 | $3,683 | $72,940 | $19,530 | $53,410 |
| 2016 | $3,683 | $72,940 | $19,530 | $53,410 |
| 2015 | $3,574 | $72,940 | $19,530 | $53,410 |
| 2014 | $3,574 | $72,940 | $19,530 | $53,410 |
Source: Public Records
Map
Nearby Homes
- 93 Winthrop St
- 70 Monroe St
- 239 Glen St Unit 2A
- 17 Kensington Ave
- 100 Shuttle Meadow Ave
- 30 Norden St
- 73 Brooklawn St
- 256 Hart St
- 21 Trinity St Unit 23
- 60 Prospect St
- 32 W Pearl St
- 42 Prospect St
- 82 Pond St
- 45 Park Place Unit 205
- 423 Monroe St
- 14 Park Place Unit 4
- 270 Maple St
- 300 W Main St
- 383 S Main St
- 300 Lincoln St