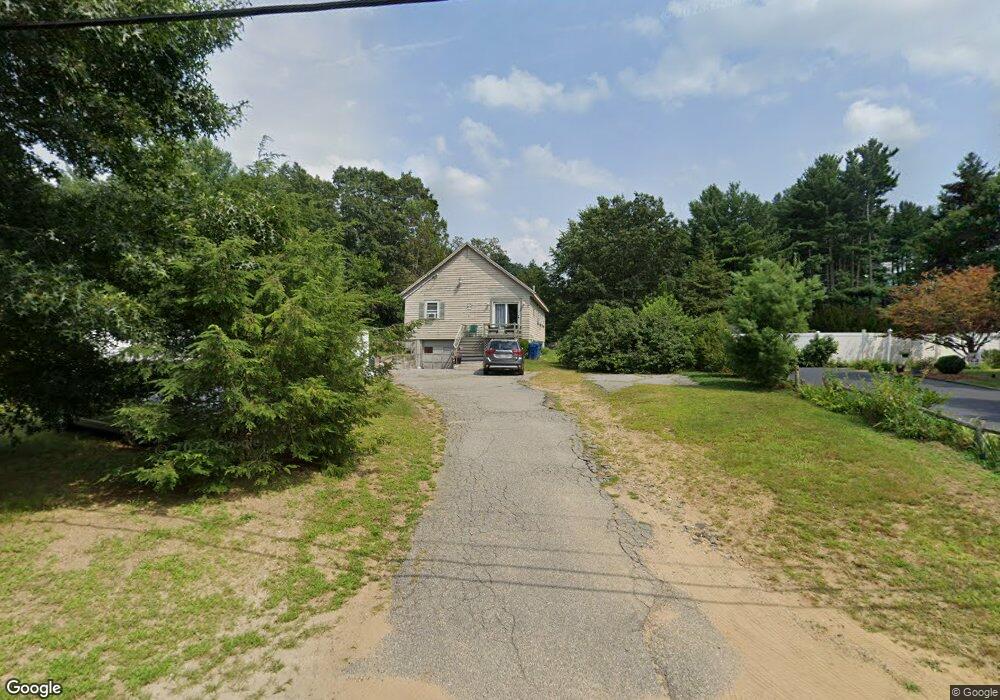
69 County Rd Tewksbury, MA 01876
Estimated Value: $547,000 - $756,000
2
Beds
1
Bath
1,400
Sq Ft
$447/Sq Ft
Est. Value
About This Home
This home is located at 69 County Rd, Tewksbury, MA 01876 and is currently estimated at $625,377, approximately $446 per square foot. 69 County Rd is a home located in Middlesex County with nearby schools including Heath-Brook Elementary School and Abundant Life Christian School and Childcare.
Ownership History
Date
Name
Owned For
Owner Type
Purchase Details
Closed on
Dec 30, 1993
Sold by
Sughrue Janet B
Bought by
Jelley Robert P and Jelley Michelle
Current Estimated Value
Home Financials for this Owner
Home Financials are based on the most recent Mortgage that was taken out on this home.
Original Mortgage
$130,000
Interest Rate
7%
Mortgage Type
Purchase Money Mortgage
Create a Home Valuation Report for This Property
The Home Valuation Report is an in-depth analysis detailing your home's value as well as a comparison with similar homes in the area
Home Values in the Area
Average Home Value in this Area
Purchase History
| Date | Buyer | Sale Price | Title Company |
|---|---|---|---|
| Jelley Robert P | $140,000 | -- |
Source: Public Records
Mortgage History
| Date | Status | Borrower | Loan Amount |
|---|---|---|---|
| Open | Jelley Robert P | $145,000 | |
| Closed | Jelley Robert P | $115,000 | |
| Closed | Jelley Robert P | $130,000 |
Source: Public Records
Tax History Compared to Growth
Tax History
| Year | Tax Paid | Tax Assessment Tax Assessment Total Assessment is a certain percentage of the fair market value that is determined by local assessors to be the total taxable value of land and additions on the property. | Land | Improvement |
|---|---|---|---|---|
| 2025 | $6,650 | $503,000 | $273,900 | $229,100 |
| 2024 | $6,258 | $467,400 | $260,900 | $206,500 |
| 2023 | $6,148 | $436,000 | $237,200 | $198,800 |
| 2022 | $5,931 | $390,200 | $206,300 | $183,900 |
| 2021 | $5,632 | $358,300 | $187,700 | $170,600 |
| 2020 | $5,420 | $339,400 | $178,600 | $160,800 |
| 2019 | $5,333 | $336,700 | $170,100 | $166,600 |
| 2018 | $5,065 | $314,000 | $170,100 | $143,900 |
| 2017 | $4,774 | $292,700 | $170,100 | $122,600 |
| 2016 | $4,604 | $281,600 | $170,100 | $111,500 |
| 2015 | $4,345 | $265,400 | $165,100 | $100,300 |
| 2014 | $4,015 | $249,200 | $165,100 | $84,100 |
Source: Public Records
Map
Nearby Homes