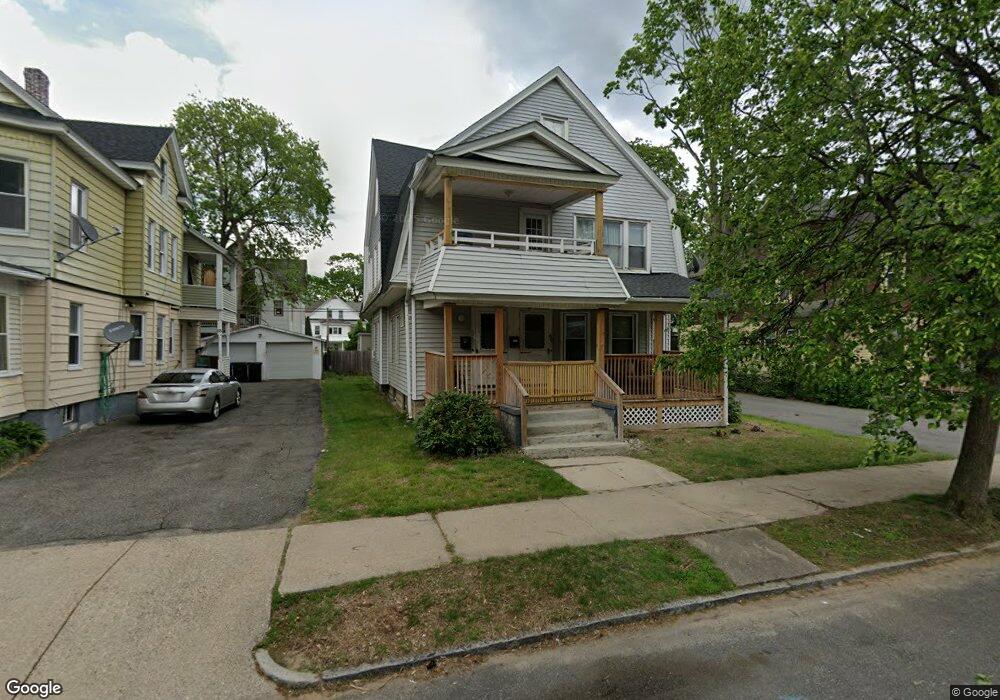
69 Dunmoreland St Springfield, MA 01109
Upper Hill NeighborhoodEstimated Value: $346,515 - $407,000
6
Beds
2
Baths
2,985
Sq Ft
$129/Sq Ft
Est. Value
About This Home
This home is located at 69 Dunmoreland St, Springfield, MA 01109 and is currently estimated at $383,879, approximately $128 per square foot. 69 Dunmoreland St is a home located in Hampden County with nearby schools including Mary M. Walsh Elementary School, M Marcus Kiley Middle, and Springfield High School of Science and Technology.
Ownership History
Date
Name
Owned For
Owner Type
Purchase Details
Closed on
Jun 22, 2019
Sold by
Wilson Venrick Est and Wilson
Bought by
Wilson Gwendolyn I
Current Estimated Value
Purchase Details
Closed on
Jun 22, 2018
Sold by
Wilson Venrick Est and Wilson
Bought by
Wilson Gwendolyn I
Purchase Details
Closed on
Sep 25, 2009
Sold by
Wilson Errol
Bought by
Wilson Errol and Wilson Venrick
Home Financials for this Owner
Home Financials are based on the most recent Mortgage that was taken out on this home.
Original Mortgage
$71,400
Interest Rate
5.31%
Mortgage Type
Purchase Money Mortgage
Purchase Details
Closed on
Mar 5, 2009
Sold by
Fiorentino Helen and Piccoli Marie L
Bought by
Wilson Errol G
Home Financials for this Owner
Home Financials are based on the most recent Mortgage that was taken out on this home.
Original Mortgage
$43,442
Interest Rate
5.14%
Mortgage Type
Purchase Money Mortgage
Create a Home Valuation Report for This Property
The Home Valuation Report is an in-depth analysis detailing your home's value as well as a comparison with similar homes in the area
Home Values in the Area
Average Home Value in this Area
Purchase History
| Date | Buyer | Sale Price | Title Company |
|---|---|---|---|
| Wilson Gwendolyn I | -- | -- | |
| Wilson Gwendolyn I | -- | -- | |
| Wilson Gwendolyn I | -- | -- | |
| Wilson Gwendolyn I | -- | -- | |
| Wilson Errol | -- | -- | |
| Wilson Errol | -- | -- | |
| Wilson Errol | -- | -- | |
| Wilson Errol G | $58,000 | -- | |
| Wilson Errol G | $58,000 | -- |
Source: Public Records
Mortgage History
| Date | Status | Borrower | Loan Amount |
|---|---|---|---|
| Previous Owner | Wilson Errol | $71,400 | |
| Previous Owner | Wilson Errol G | $43,442 |
Source: Public Records
Tax History Compared to Growth
Tax History
| Year | Tax Paid | Tax Assessment Tax Assessment Total Assessment is a certain percentage of the fair market value that is determined by local assessors to be the total taxable value of land and additions on the property. | Land | Improvement |
|---|---|---|---|---|
| 2025 | $4,900 | $312,500 | $31,100 | $281,400 |
| 2024 | $4,635 | $288,600 | $31,100 | $257,500 |
| 2023 | $4,525 | $265,400 | $28,300 | $237,100 |
| 2022 | $4,842 | $257,300 | $26,400 | $230,900 |
| 2021 | $3,950 | $209,000 | $18,700 | $190,300 |
| 2020 | $3,795 | $194,300 | $18,700 | $175,600 |
| 2019 | $3,257 | $165,500 | $16,000 | $149,500 |
| 2018 | $3,216 | $163,400 | $16,000 | $147,400 |
| 2017 | $3,039 | $154,600 | $15,000 | $139,600 |
| 2016 | $2,682 | $136,400 | $15,000 | $121,400 |
| 2015 | $2,628 | $133,600 | $15,000 | $118,600 |
Source: Public Records
Map
Nearby Homes
- 88 Dunmoreland St
- 19 Westford Ave
- 124-126 Westford Cir
- 21 Westford Cir
- 179 Albemarle St
- 62-64 Bristol St
- 140 Northampton Ave
- 135-137 Suffolk St
- 162 Northampton Ave
- 192-194 Westford Ave
- 43 Colonial Ave
- 111 Marlborough St
- 158 Norfolk St
- 290 Quincy St
- 65 Montrose St
- 58 Willard Ave
- 67 Carlisle St
- 52-56 Andrew St
- 129 Eastern Ave
- 15 Kenyon St
- 75 Dunmoreland St
- 63 Dunmoreland St
- 77 Dunmoreland St
- 70 Albemarle St Unit 72
- 76 Albemarle St Unit 78
- 64 Albemarle St Unit 66
- 57 Dunmoreland St
- 81 Dunmoreland St
- 64-66 Albermarle St
- 68 Dunmoreland St Unit 70
- 82 Albemarle St Unit 84
- 62 Dunmoreland St Unit 64
- 76 Dunmoreland St
- 58 Albemarle St Unit 60
- 58 Albemarle St Unit 58
- 58-60 Albemarle St
- 89 Dunmoreland St
- 51 Dunmoreland St
- 56 Dunmoreland St Unit 58
- 82 Dunmoreland St