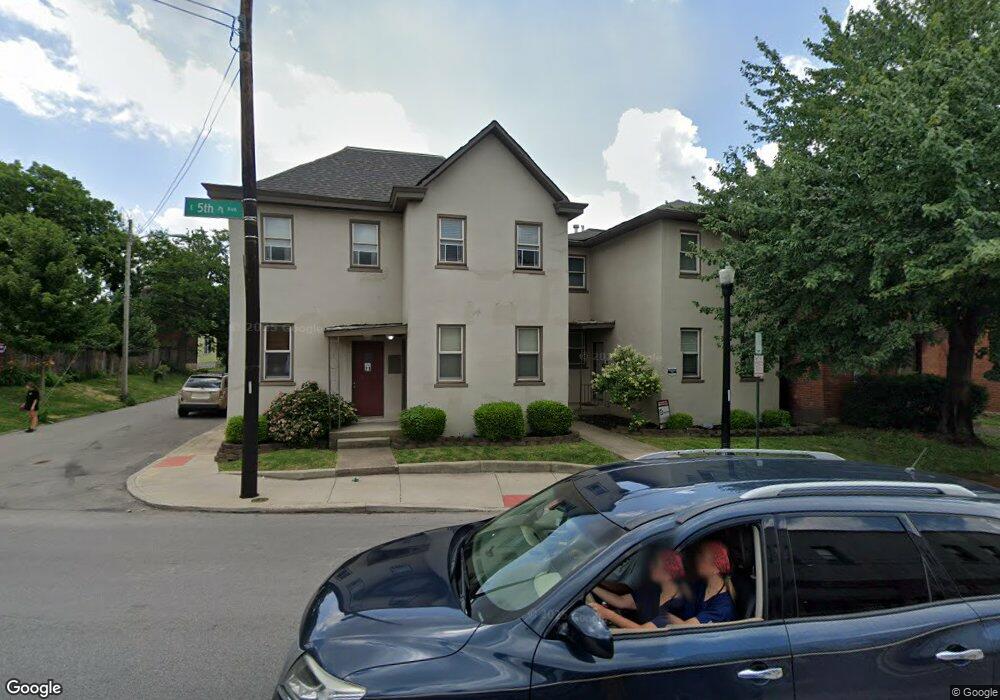
69 E 5th Ave Unit 2 Columbus, OH 43201
Short North NeighborhoodEstimated Value: $188,000 - $239,000
1
Bed
1
Bath
632
Sq Ft
$323/Sq Ft
Est. Value
About This Home
This home is located at 69 E 5th Ave Unit 2, Columbus, OH 43201 and is currently estimated at $204,105, approximately $322 per square foot. 69 E 5th Ave Unit 2 is a home located in Franklin County with nearby schools including Hubbard Elementary School, Dominion Middle School, and Whetstone High School.
Ownership History
Date
Name
Owned For
Owner Type
Purchase Details
Closed on
Oct 15, 2021
Sold by
Kade Marc
Bought by
Kade Marc and Kade Jennifer
Current Estimated Value
Purchase Details
Closed on
Oct 30, 2019
Sold by
Blue Mark
Bought by
Kade Marc
Purchase Details
Closed on
Aug 10, 2015
Sold by
Jones Audra A
Bought by
Blue Mark
Purchase Details
Closed on
Apr 22, 2014
Sold by
Sleasman Jeffrey W
Bought by
Jones Audra A
Home Financials for this Owner
Home Financials are based on the most recent Mortgage that was taken out on this home.
Original Mortgage
$96,000
Interest Rate
4.33%
Mortgage Type
New Conventional
Purchase Details
Closed on
Jan 27, 2008
Sold by
Urban Vision Properties Llc
Bought by
Sleasman Jeffrey W
Home Financials for this Owner
Home Financials are based on the most recent Mortgage that was taken out on this home.
Original Mortgage
$96,900
Interest Rate
5.96%
Mortgage Type
Unknown
Create a Home Valuation Report for This Property
The Home Valuation Report is an in-depth analysis detailing your home's value as well as a comparison with similar homes in the area
Home Values in the Area
Average Home Value in this Area
Purchase History
| Date | Buyer | Sale Price | Title Company |
|---|---|---|---|
| Kade Marc | -- | None Available | |
| Kade Marc | $159,300 | First Ohio Title Ins Box | |
| Blue Mark | $132,000 | Attorney | |
| Jones Audra A | $120,000 | None Available | |
| Sleasman Jeffrey W | $102,000 | Elite Title |
Source: Public Records
Mortgage History
| Date | Status | Borrower | Loan Amount |
|---|---|---|---|
| Previous Owner | Jones Audra A | $96,000 | |
| Previous Owner | Sleasman Jeffrey W | $96,900 |
Source: Public Records
Tax History
| Year | Tax Paid | Tax Assessment Tax Assessment Total Assessment is a certain percentage of the fair market value that is determined by local assessors to be the total taxable value of land and additions on the property. | Land | Improvement |
|---|---|---|---|---|
| 2025 | $2,478 | $53,200 | $22,750 | $30,450 |
| 2024 | $2,478 | $53,200 | $22,750 | $30,450 |
| 2023 | $2,447 | $53,200 | $22,750 | $30,450 |
| 2022 | $3,657 | $45,160 | $16,630 | $28,530 |
| 2021 | $2,436 | $45,160 | $16,630 | $28,530 |
| 2020 | $2,439 | $45,160 | $16,630 | $28,530 |
| 2019 | $2,160 | $34,730 | $12,780 | $21,950 |
| 2018 | $1,078 | $34,730 | $12,780 | $21,950 |
| 2017 | $2,106 | $34,730 | $12,780 | $21,950 |
| 2016 | $2,314 | $34,930 | $5,880 | $29,050 |
| 2015 | $2,100 | $34,930 | $5,880 | $29,050 |
| 2014 | $2,106 | $34,930 | $5,880 | $29,050 |
| 2013 | $150 | $5,040 | $1,610 | $3,430 |
Source: Public Records
Map
Nearby Homes
- 63 Smith Place
- 30 W 4th Ave
- 1145 N High St Unit 203
- 1145 N High St Unit 404
- 1145 N High St Unit 307
- 1145 N High St Unit 202
- 1131 N High St Unit 301
- 1276 N High St Unit 402
- 231 W 4th Ave
- 1355 Dennison Ave Unit 1357
- 1098 Highland St
- 93 King Ave Unit 95
- 80 W Starr Ave
- 137 King Ave
- 17 W 3rd Ave Unit 212
- 17 W 3rd Ave Unit 213
- 42 King Ave
- 1105 Say Ave
- 1029 Hunter Ave
- 138 E Greenwood Ave
- 69 E 5th Ave Unit 1
- 69 W 5th Ave Unit 71
- 7375 Milt Caniff Blvd W
- 61 W 5th Ave Unit 63
- 69-71 E 5th Ave Unit 1
- 69-71 E 5th Ave Unit 2
- 79 W 5th Ave
- 59 W 5th Ave
- 59-59.5 W 5th Ave
- 53-55 E 5th Ave
- 83 W 5th Ave
- 53 W 5th Ave Unit 55
- 80 W Greenwood Ave
- 51 W 5th Ave
- 76 W Greenwood Ave
- 86 W Greenwood Ave
- 95 W 5th Ave
- 1216 Dennison Ave
- 90 W Greenwood Ave
- 78 W Greenwood Ave
Your Personal Tour Guide
Ask me questions while you tour the home.