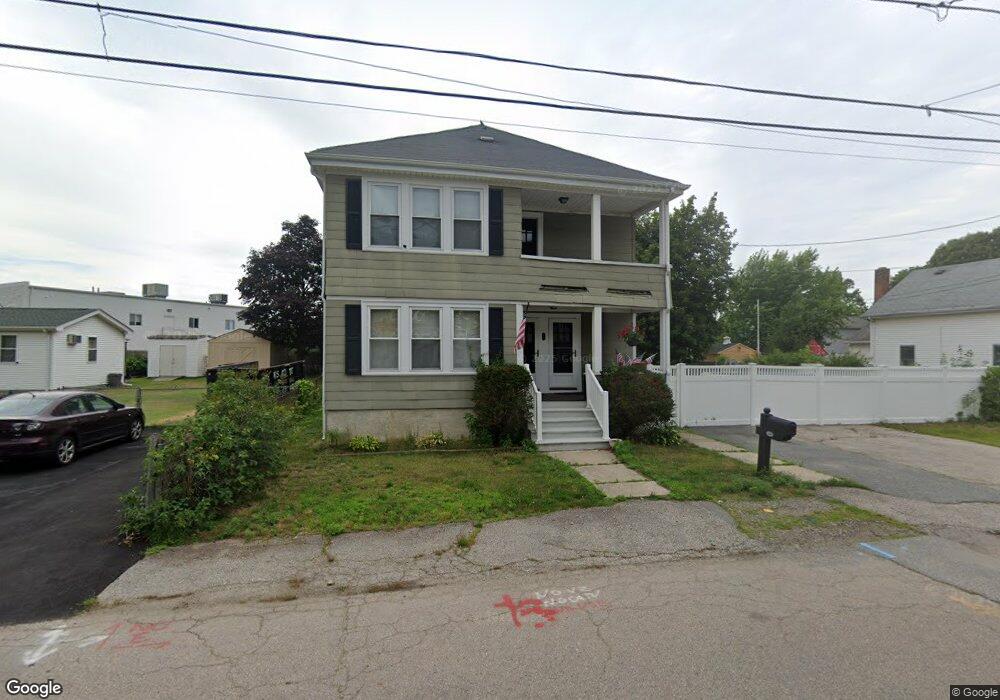
69 E Bacon St Attleboro, MA 02703
Estimated Value: $495,000 - $616,000
4
Beds
2
Baths
2,420
Sq Ft
$229/Sq Ft
Est. Value
About This Home
This home is located at 69 E Bacon St, Attleboro, MA 02703 and is currently estimated at $553,877, approximately $228 per square foot. 69 E Bacon St is a home located in Bristol County with nearby schools including Hill-Roberts Elementary School, Robert J. Coelho Middle School, and Attleboro High School.
Ownership History
Date
Name
Owned For
Owner Type
Purchase Details
Closed on
May 20, 2008
Sold by
Mcaloon Joan A and Mccarthy Kristen
Bought by
Mccarthy Kristen and Mccarthy Brittany T
Current Estimated Value
Purchase Details
Closed on
Nov 22, 2004
Sold by
Mcaloon Joan A
Bought by
Mcaloon Joan A and Mccarthy Kristen
Home Financials for this Owner
Home Financials are based on the most recent Mortgage that was taken out on this home.
Original Mortgage
$110,000
Interest Rate
5.8%
Mortgage Type
Purchase Money Mortgage
Create a Home Valuation Report for This Property
The Home Valuation Report is an in-depth analysis detailing your home's value as well as a comparison with similar homes in the area
Home Values in the Area
Average Home Value in this Area
Purchase History
| Date | Buyer | Sale Price | Title Company |
|---|---|---|---|
| Mccarthy Kristen | -- | -- | |
| Mcaloon Joan A | -- | -- |
Source: Public Records
Mortgage History
| Date | Status | Borrower | Loan Amount |
|---|---|---|---|
| Previous Owner | Mcaloon Joan A | $110,000 |
Source: Public Records
Tax History Compared to Growth
Tax History
| Year | Tax Paid | Tax Assessment Tax Assessment Total Assessment is a certain percentage of the fair market value that is determined by local assessors to be the total taxable value of land and additions on the property. | Land | Improvement |
|---|---|---|---|---|
| 2025 | $5,376 | $428,400 | $124,800 | $303,600 |
| 2024 | $5,207 | $409,000 | $124,800 | $284,200 |
| 2023 | $4,655 | $340,000 | $113,400 | $226,600 |
| 2022 | $4,286 | $296,600 | $108,100 | $188,500 |
| 2021 | $4,144 | $280,000 | $103,900 | $176,100 |
| 2020 | $3,882 | $266,600 | $100,900 | $165,700 |
| 2019 | $3,670 | $259,200 | $98,900 | $160,300 |
| 2018 | $3,735 | $229,100 | $96,000 | $133,100 |
| 2017 | $3,363 | $231,100 | $96,000 | $135,100 |
| 2016 | $3,118 | $210,400 | $94,200 | $116,200 |
| 2015 | $2,954 | $200,800 | $94,200 | $106,600 |
| 2014 | $2,749 | $185,100 | $89,800 | $95,300 |
Source: Public Records
Map
Nearby Homes
- 79 Turner St
- 37 Turner St
- 61 Mendon Rd
- 18 Newton St
- 23 Colvin St
- 50 Pullman Ave Unit A
- 50 Pullman Ave Unit B
- 735 Broadway
- 91 Greenwich St
- 27 Collins Ave
- 179 Columbine Ave
- 171 Mendon Rd
- 58 Baltic St Unit 58
- 56 Baltic St Unit 56
- 54 Baltic St Unit 54
- 52 Baltic St Unit 52
- 39 John St
- 207 Benefit St
- 19 Lodi St
- 39 Webster St Unit 204