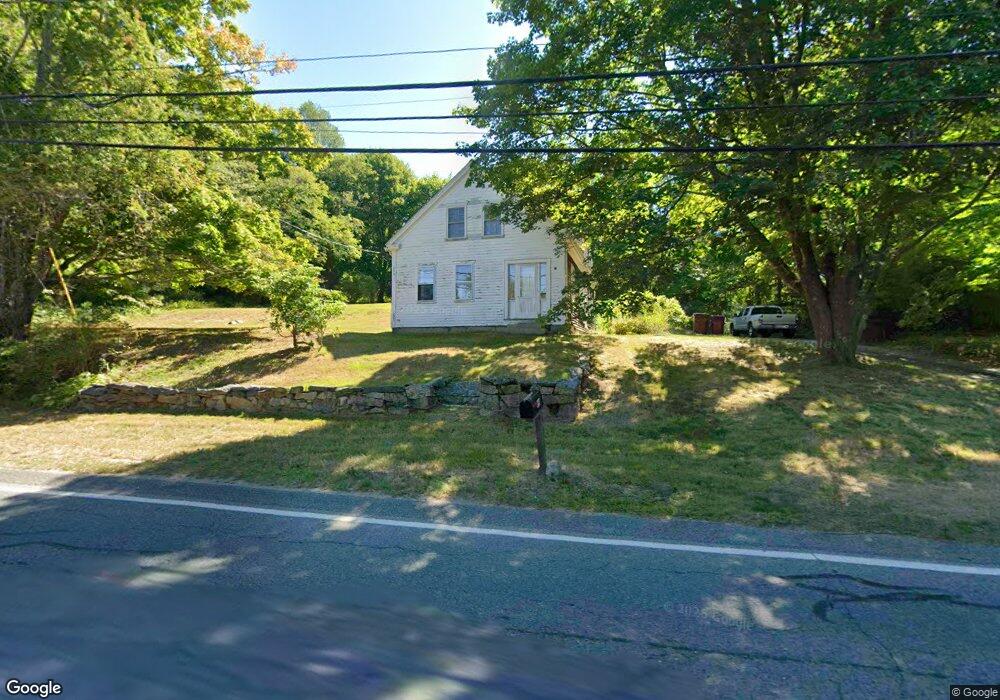
69 E Main St Middleboro, MA 02346
Estimated Value: $438,000 - $586,000
3
Beds
1
Bath
1,832
Sq Ft
$265/Sq Ft
Est. Value
About This Home
This home is located at 69 E Main St, Middleboro, MA 02346 and is currently estimated at $485,401, approximately $264 per square foot. 69 E Main St is a home located in Plymouth County with nearby schools including Mary K. Goode Elementary School, Mullein Hill Christian Academy, and Samuel Fuller School.
Ownership History
Date
Name
Owned For
Owner Type
Purchase Details
Closed on
Oct 24, 2000
Sold by
Pierce Edward S and Pierce Jeannette H
Bought by
Watson Sara Hill
Current Estimated Value
Create a Home Valuation Report for This Property
The Home Valuation Report is an in-depth analysis detailing your home's value as well as a comparison with similar homes in the area
Home Values in the Area
Average Home Value in this Area
Purchase History
| Date | Buyer | Sale Price | Title Company |
|---|---|---|---|
| Watson Sara Hill | $155,000 | -- |
Source: Public Records
Mortgage History
| Date | Status | Borrower | Loan Amount |
|---|---|---|---|
| Open | Watson Sara Hill | $100,000 | |
| Closed | Watson Sara Hill | $35,000 |
Source: Public Records
Tax History
| Year | Tax Paid | Tax Assessment Tax Assessment Total Assessment is a certain percentage of the fair market value that is determined by local assessors to be the total taxable value of land and additions on the property. | Land | Improvement |
|---|---|---|---|---|
| 2025 | $4,487 | $334,600 | $160,700 | $173,900 |
| 2024 | $4,224 | $312,000 | $153,100 | $158,900 |
| 2023 | $4,252 | $298,600 | $153,100 | $145,500 |
| 2022 | $3,962 | $257,600 | $133,200 | $124,400 |
| 2021 | $3,770 | $231,700 | $116,900 | $114,800 |
| 2020 | $3,546 | $223,300 | $116,900 | $106,400 |
| 2019 | $3,339 | $215,700 | $116,900 | $98,800 |
| 2018 | $3,441 | $220,600 | $111,000 | $109,600 |
| 2017 | $3,239 | $205,400 | $106,800 | $98,600 |
| 2016 | $3,252 | $204,300 | $98,000 | $106,300 |
| 2015 | $3,137 | $198,800 | $98,000 | $100,800 |
Source: Public Records
Map
Nearby Homes
- 227 E Main St
- 240 N Main St
- 6 Barrows St
- 308 Wood St
- 26 Wareham St
- 28 School St
- 17 Cobblestone Ln
- 0 Wareham Miller St Unit 73410845
- 18 Rock St
- 6 Rock St
- LOT A Wood St
- 620 Plymouth St
- 15 Pearl St
- 80 Forest St
- 132 Everett St
- 10 Old Thompson St
- 135 E Grove St
- 129 Thomas St
- 17 Landing Way Unit 17
- 162 E Grove St