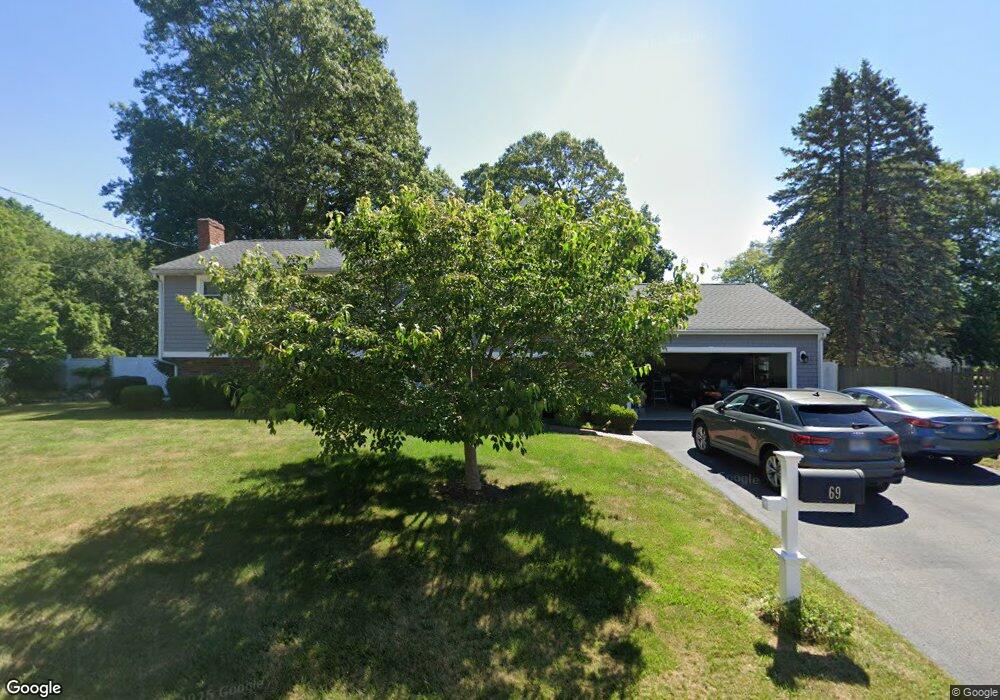
69 Eastfield Dr Brockton, MA 02302
Montello NeighborhoodEstimated Value: $550,000 - $574,000
3
Beds
2
Baths
1,584
Sq Ft
$353/Sq Ft
Est. Value
About This Home
This home is located at 69 Eastfield Dr, Brockton, MA 02302 and is currently estimated at $559,882, approximately $353 per square foot. 69 Eastfield Dr is a home located in Plymouth County with nearby schools including Brookfield Elementary School, Mary E. Baker Elementary School, and Downey Elementary School.
Ownership History
Date
Name
Owned For
Owner Type
Purchase Details
Closed on
Dec 2, 2015
Sold by
Sabina Irena
Bought by
Irena Sabina Ret
Current Estimated Value
Purchase Details
Closed on
Jun 4, 2015
Sold by
Irena Sabina Ret
Bought by
Sabina Irena
Purchase Details
Closed on
Nov 4, 2011
Sold by
Sabina Irena
Bought by
Irena Sabina Ret
Purchase Details
Closed on
Mar 17, 1999
Sold by
Sabina Irena and Sabina Eugene M
Bought by
Sabina Irena
Home Financials for this Owner
Home Financials are based on the most recent Mortgage that was taken out on this home.
Original Mortgage
$17,500
Interest Rate
6.74%
Mortgage Type
Purchase Money Mortgage
Create a Home Valuation Report for This Property
The Home Valuation Report is an in-depth analysis detailing your home's value as well as a comparison with similar homes in the area
Home Values in the Area
Average Home Value in this Area
Purchase History
| Date | Buyer | Sale Price | Title Company |
|---|---|---|---|
| Irena Sabina Ret | -- | -- | |
| Sabina Irena | -- | -- | |
| Irena Sabina Ret | -- | -- | |
| Sabina Irena | $17,500 | -- |
Source: Public Records
Mortgage History
| Date | Status | Borrower | Loan Amount |
|---|---|---|---|
| Previous Owner | Sabina Irena | $17,500 | |
| Previous Owner | Sabina Irena | $60,000 | |
| Previous Owner | Sabina Irena | $78,000 |
Source: Public Records
Tax History Compared to Growth
Tax History
| Year | Tax Paid | Tax Assessment Tax Assessment Total Assessment is a certain percentage of the fair market value that is determined by local assessors to be the total taxable value of land and additions on the property. | Land | Improvement |
|---|---|---|---|---|
| 2025 | $6,193 | $511,400 | $148,900 | $362,500 |
| 2024 | $6,077 | $505,600 | $148,900 | $356,700 |
| 2023 | $5,605 | $431,800 | $114,200 | $317,600 |
| 2022 | $5,079 | $363,600 | $103,900 | $259,700 |
| 2021 | $5,181 | $357,300 | $97,500 | $259,800 |
| 2020 | $4,948 | $326,600 | $93,400 | $233,200 |
| 2019 | $4,771 | $307,000 | $87,500 | $219,500 |
| 2018 | $4,956 | $308,600 | $87,500 | $221,100 |
| 2017 | $4,144 | $257,400 | $87,500 | $169,900 |
| 2016 | $4,010 | $231,000 | $83,600 | $147,400 |
| 2015 | $3,801 | $209,400 | $83,600 | $125,800 |
| 2014 | $3,733 | $205,900 | $83,600 | $122,300 |
Source: Public Records
Map
Nearby Homes