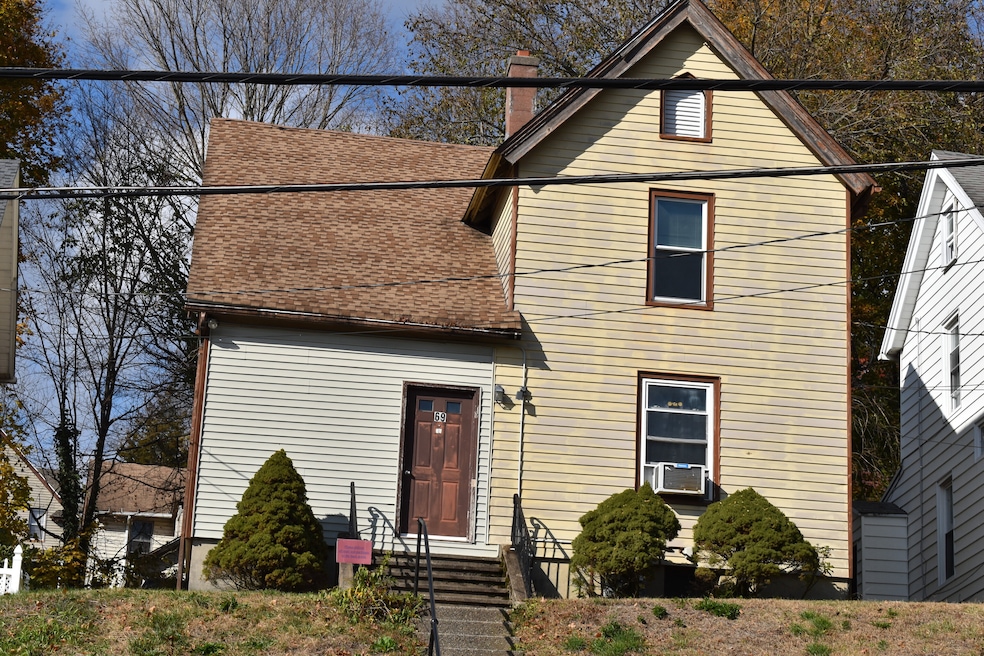

69 Easton Ave Waterbury, CT 06704
North End District NeighborhoodEstimated payment $1,257/month
Highlights
- Colonial Architecture
- Thermal Windows
- Hot Water Circulator
- Attic
- Storm Windows
- Hot Water Heating System
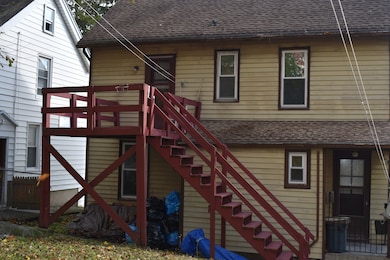
About This Home
Investment opportunity! 4 bdrm colonial, newer thermopane windows and insulation in attic and basement 2023, walk up attic, natural gas heat, walk in closet, newer laminate floors upper level, full basement. Town records state 1 full and 1 half bathroom, has 2 full bathrooms. Will not qualify for financing, cash offers only.
Listing Agent
Showcase Realty, Inc. Brokerage Phone: (203) 233-7732 License #RES.0767520 Listed on: 11/10/2025

Home Details
Home Type
- Single Family
Est. Annual Taxes
- $2,517
Year Built
- Built in 1905
Lot Details
- 6,098 Sq Ft Lot
- Sloped Lot
- Property is zoned RM
Home Design
- Colonial Architecture
- Concrete Foundation
- Frame Construction
- Asphalt Shingled Roof
- Aluminum Siding
Interior Spaces
- 1,488 Sq Ft Home
- Thermal Windows
- Basement Fills Entire Space Under The House
- Walkup Attic
- Storm Windows
- Oven or Range
Bedrooms and Bathrooms
- 4 Bedrooms
Utilities
- Hot Water Heating System
- Heating System Uses Natural Gas
- Hot Water Circulator
Listing and Financial Details
- Assessor Parcel Number 1377068
Map
Home Values in the Area
Average Home Value in this Area
Tax History
| Year | Tax Paid | Tax Assessment Tax Assessment Total Assessment is a certain percentage of the fair market value that is determined by local assessors to be the total taxable value of land and additions on the property. | Land | Improvement |
|---|---|---|---|---|
| 2025 | $2,796 | $62,160 | $12,600 | $49,560 |
| 2024 | $3,073 | $62,160 | $12,600 | $49,560 |
| 2023 | $3,368 | $62,160 | $12,600 | $49,560 |
| 2022 | $2,247 | $37,320 | $12,600 | $24,720 |
| 2021 | $2,247 | $37,320 | $12,600 | $24,720 |
| 2020 | $2,247 | $37,320 | $12,600 | $24,720 |
| 2019 | $2,247 | $37,320 | $12,600 | $24,720 |
| 2018 | $2,247 | $37,320 | $12,600 | $24,720 |
| 2017 | $2,366 | $39,300 | $12,600 | $26,700 |
| 2016 | $2,366 | $39,300 | $12,600 | $26,700 |
| 2015 | $2,288 | $39,300 | $12,600 | $26,700 |
| 2014 | $2,288 | $39,300 | $12,600 | $26,700 |
Property History
| Date | Event | Price | List to Sale | Price per Sq Ft |
|---|---|---|---|---|
| 11/10/2025 11/10/25 | For Sale | $199,000 | -- | $134 / Sq Ft |
Purchase History
| Date | Type | Sale Price | Title Company |
|---|---|---|---|
| Deed | $85,000 | -- |
Mortgage History
| Date | Status | Loan Amount | Loan Type |
|---|---|---|---|
| Closed | $67,000 | No Value Available | |
| Closed | $66,500 | No Value Available | |
| Closed | $68,000 | Purchase Money Mortgage |
Source: SmartMLS
MLS Number: 24139235
APN: WATE-000218-000187-000024
Disclaimer: Certain information contained herein is derived from information provided by parties other than Homes.com. All information provided is deemed reliable, but is not guaranteed to be accurate and should be independently verified.
![]() IDX information is provided exclusively for personal, non-commercial use, and may not be used for any purpose other than to identify prospective properties consumers may be interested in purchasing. Information is deemed reliable but not guaranteed.
IDX information is provided exclusively for personal, non-commercial use, and may not be used for any purpose other than to identify prospective properties consumers may be interested in purchasing. Information is deemed reliable but not guaranteed.
- 120 Easton Ave
- 22 Brewster St Unit D
- 49 Hill St Unit 3
- 49 Hill St Unit 4
- 24 Cassidy Ave Unit 1st floor
- 1105 N Main St Unit 3
- 1105 N Main St Unit 1
- 66 York St
- 21 N Beacon St Unit 2
- 290 Orange St Unit 1
- 14 Wood St Unit 1
- 118 E Farm St Unit 1
- 118 E Farm St
- 124 Division St
- 132 Locust St Unit 4
- 132 Locust St Unit 14
- 132 Locust St Unit 13
- 30 Doran St
- 59 Ward St Unit 3
- 89 Wood St Unit 1