Estimated Value: $637,000 - $936,000
4
Beds
2
Baths
2,248
Sq Ft
$334/Sq Ft
Est. Value
About This Home
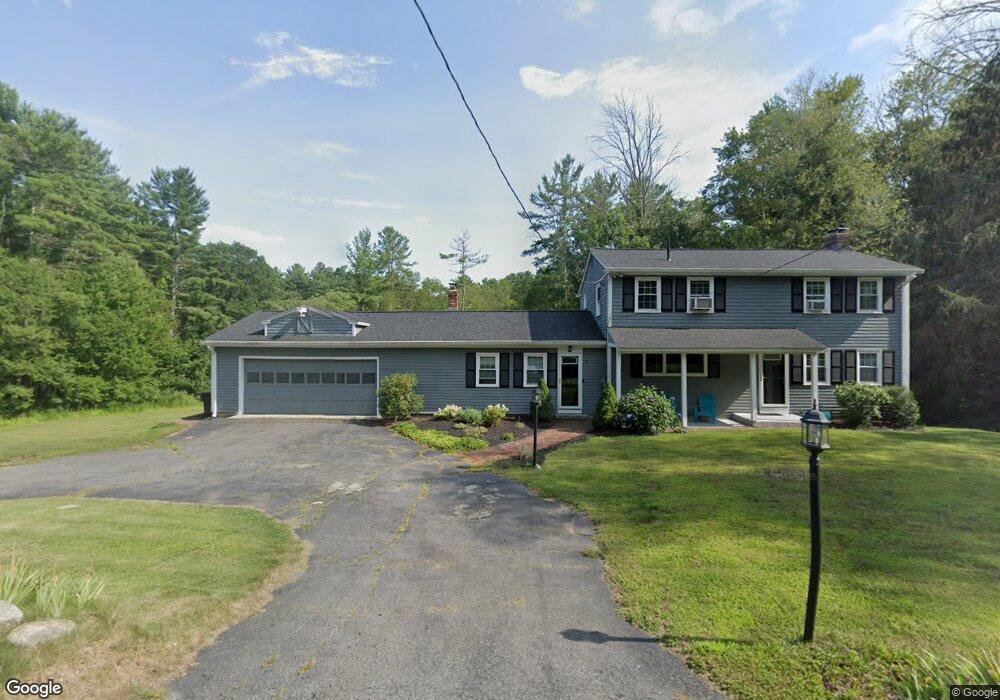
This home is located at 69 Elm St, Upton, MA 01568 and is currently estimated at $750,220, approximately $333 per square foot. 69 Elm St is a home located in Worcester County with nearby schools including Nipmuc Regional High School and Touchstone Community School.
Ownership History
Date
Name
Owned For
Owner Type
Purchase Details
Closed on
Apr 1, 2003
Sold by
Bertrand Julius F and Bertrand Betsy J
Bought by
Marseglia Paul D
Current Estimated Value
Home Financials for this Owner
Home Financials are based on the most recent Mortgage that was taken out on this home.
Original Mortgage
$296,000
Outstanding Balance
$128,653
Interest Rate
5.91%
Mortgage Type
Purchase Money Mortgage
Estimated Equity
$621,567
Purchase Details
Closed on
May 14, 1987
Sold by
Royce J M
Bought by
Bertrand Betsy J
Create a Home Valuation Report for This Property
The Home Valuation Report is an in-depth analysis detailing your home's value as well as a comparison with similar homes in the area
Home Values in the Area
Average Home Value in this Area
Purchase History
| Date | Buyer | Sale Price | Title Company |
|---|---|---|---|
| Marseglia Paul D | $370,000 | -- | |
| Marseglia Paul D | $370,000 | -- | |
| Bertrand Betsy J | $254,000 | -- |
Source: Public Records
Mortgage History
| Date | Status | Borrower | Loan Amount |
|---|---|---|---|
| Open | Bertrand Betsy J | $296,000 | |
| Closed | Bertrand Betsy J | $296,000 | |
| Previous Owner | Bertrand Betsy J | $195,000 | |
| Previous Owner | Bertrand Betsy J | $157,935 |
Source: Public Records
Tax History
| Year | Tax Paid | Tax Assessment Tax Assessment Total Assessment is a certain percentage of the fair market value that is determined by local assessors to be the total taxable value of land and additions on the property. | Land | Improvement |
|---|---|---|---|---|
| 2025 | $7,268 | $552,700 | $277,200 | $275,500 |
| 2024 | $7,019 | $513,100 | $253,200 | $259,900 |
| 2023 | $5,599 | $403,700 | $213,200 | $190,500 |
| 2022 | $6,770 | $403,700 | $213,200 | $190,500 |
| 2021 | $3,845 | $394,200 | $214,800 | $179,400 |
| 2020 | $6,351 | $368,800 | $192,400 | $176,400 |
| 2019 | $6,294 | $363,600 | $184,400 | $179,200 |
| 2018 | $6,060 | $351,700 | $177,200 | $174,500 |
| 2017 | $6,212 | $326,500 | $166,000 | $160,500 |
| 2016 | $6,303 | $339,600 | $169,200 | $170,400 |
| 2015 | $5,709 | $336,800 | $169,200 | $167,600 |
| 2014 | $5,517 | $325,500 | $161,200 | $164,300 |
Source: Public Records
Map
Nearby Homes
- 29 Cider Mill Ln
- 31 Elm St
- 130 High St
- 8 Maple St
- 7 Fieldstone Dr Unit 7
- 6 Fieldstone Dr Unit 6
- 78 Milford St
- 6 Wood St
- 13 Plain St
- 4 Hazeltine Rd
- 74 Warren St
- 72 Main St
- 11 East St
- 63 Rockwood Ln Unit 63
- 18 Boot Shop Rd Unit 40
- 300 W Main St
- 12 Boot Shop Rd Unit 37
- 5 Boot Shop Rd Unit 31
- 50 Pinecrest Village Unit 50
- 1 Knowlton Cir Unit 1
Your Personal Tour Guide
Ask me questions while you tour the home.