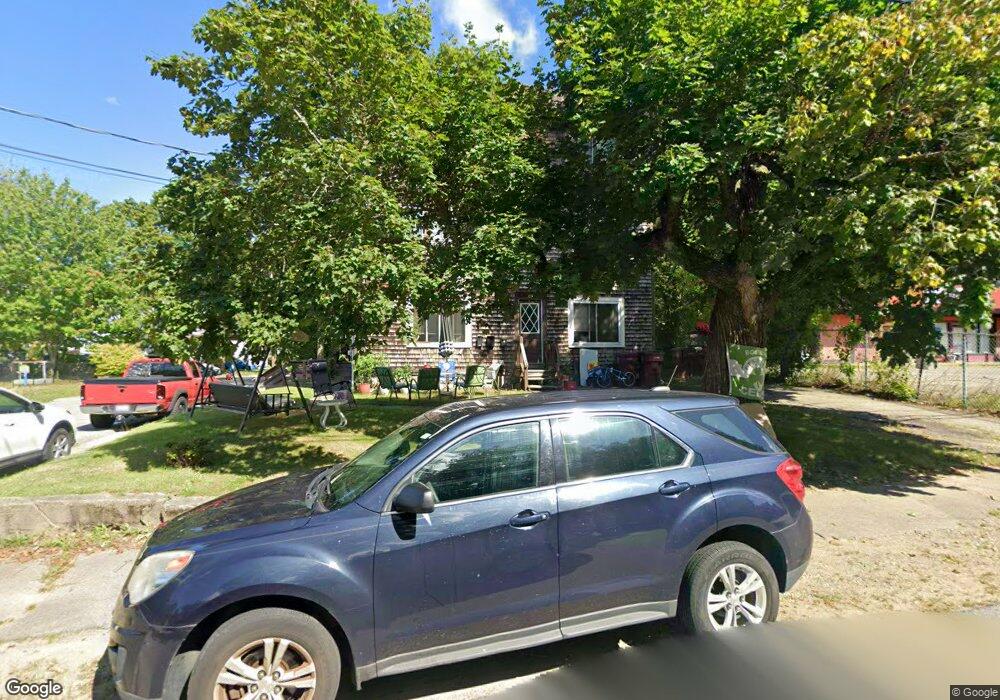
69 Everett St Middleboro, MA 02346
Estimated Value: $612,000 - $727,000
5
Beds
3
Baths
3,348
Sq Ft
$199/Sq Ft
Est. Value
About This Home
This home is located at 69 Everett St, Middleboro, MA 02346 and is currently estimated at $665,896, approximately $198 per square foot. 69 Everett St is a home located in Plymouth County with nearby schools including Mary K. Goode Elementary School and Mullein Hill Christian Academy.
Ownership History
Date
Name
Owned For
Owner Type
Purchase Details
Closed on
May 5, 2023
Sold by
Smith Malcolm F and Smith Pamela A
Bought by
69 Everett Llc
Current Estimated Value
Purchase Details
Closed on
Apr 13, 2000
Sold by
Thomas Stephen M and Thomas Norma
Bought by
Smith Malcolm F and Smith Pamela A
Home Financials for this Owner
Home Financials are based on the most recent Mortgage that was taken out on this home.
Original Mortgage
$148,000
Interest Rate
8.26%
Mortgage Type
Purchase Money Mortgage
Purchase Details
Closed on
Jan 28, 1997
Sold by
69 Everett St Nt and Reilly
Bought by
Thomas Stephen M and Thomas Norma
Purchase Details
Closed on
Nov 29, 1996
Sold by
B Williams Rt and Williams
Bought by
69 Everett St Nt and Relly
Create a Home Valuation Report for This Property
The Home Valuation Report is an in-depth analysis detailing your home's value as well as a comparison with similar homes in the area
Home Values in the Area
Average Home Value in this Area
Purchase History
| Date | Buyer | Sale Price | Title Company |
|---|---|---|---|
| 69 Everett Llc | -- | None Available | |
| Smith Malcolm F | $185,000 | -- | |
| Thomas Stephen M | $127,900 | -- | |
| 69 Everett St Nt | $79,200 | -- |
Source: Public Records
Mortgage History
| Date | Status | Borrower | Loan Amount |
|---|---|---|---|
| Previous Owner | 69 Everett St Nt | $148,000 | |
| Previous Owner | 69 Everett St Nt | $148,000 | |
| Previous Owner | 69 Everett St Nt | $134,960 |
Source: Public Records
Tax History Compared to Growth
Tax History
| Year | Tax Paid | Tax Assessment Tax Assessment Total Assessment is a certain percentage of the fair market value that is determined by local assessors to be the total taxable value of land and additions on the property. | Land | Improvement |
|---|---|---|---|---|
| 2025 | $5,723 | $426,800 | $153,900 | $272,900 |
| 2024 | $5,742 | $424,100 | $146,600 | $277,500 |
| 2023 | $5,249 | $368,600 | $146,600 | $222,000 |
| 2022 | $5,534 | $359,800 | $127,500 | $232,300 |
| 2021 | $5,599 | $344,100 | $111,800 | $232,300 |
| 2020 | $4,713 | $296,800 | $111,800 | $185,000 |
| 2019 | $4,435 | $286,500 | $111,800 | $174,700 |
| 2018 | $4,072 | $261,000 | $106,500 | $154,500 |
| 2017 | $3,758 | $238,300 | $102,400 | $135,900 |
| 2016 | $3,714 | $233,300 | $93,700 | $139,600 |
| 2015 | $3,623 | $229,600 | $93,700 | $135,900 |
Source: Public Records
Map
Nearby Homes