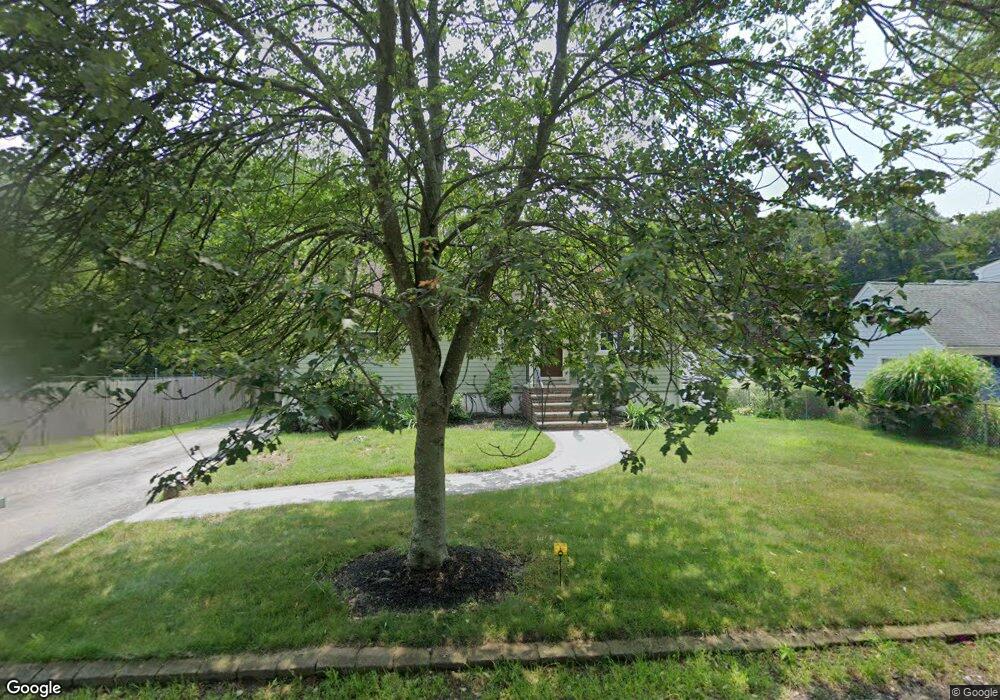
69 Federal St Weymouth, MA 02188
Weymouth Landing NeighborhoodEstimated Value: $528,000 - $581,617
3
Beds
1
Bath
888
Sq Ft
$627/Sq Ft
Est. Value
About This Home
This home is located at 69 Federal St, Weymouth, MA 02188 and is currently estimated at $556,404, approximately $626 per square foot. 69 Federal St is a home located in Norfolk County with nearby schools including Frederick C Murphy, Abigail Adams Middle School, and Weymouth Middle School Chapman.
Ownership History
Date
Name
Owned For
Owner Type
Purchase Details
Closed on
Aug 29, 2008
Sold by
Simourian Edward A and Simourian John A
Bought by
Burns John J
Current Estimated Value
Home Financials for this Owner
Home Financials are based on the most recent Mortgage that was taken out on this home.
Original Mortgage
$146,400
Outstanding Balance
$94,925
Interest Rate
6.17%
Mortgage Type
Purchase Money Mortgage
Estimated Equity
$461,479
Purchase Details
Closed on
Jul 21, 2008
Sold by
Simourian John and Chapman Nicole
Bought by
Burns John J
Home Financials for this Owner
Home Financials are based on the most recent Mortgage that was taken out on this home.
Original Mortgage
$146,400
Outstanding Balance
$94,925
Interest Rate
6.17%
Mortgage Type
Purchase Money Mortgage
Estimated Equity
$461,479
Create a Home Valuation Report for This Property
The Home Valuation Report is an in-depth analysis detailing your home's value as well as a comparison with similar homes in the area
Home Values in the Area
Average Home Value in this Area
Purchase History
| Date | Buyer | Sale Price | Title Company |
|---|---|---|---|
| Burns John J | -- | -- | |
| Burns John J | -- | -- | |
| Burns John J | $183,000 | -- |
Source: Public Records
Mortgage History
| Date | Status | Borrower | Loan Amount |
|---|---|---|---|
| Open | Burns John J | $146,400 |
Source: Public Records
Tax History Compared to Growth
Tax History
| Year | Tax Paid | Tax Assessment Tax Assessment Total Assessment is a certain percentage of the fair market value that is determined by local assessors to be the total taxable value of land and additions on the property. | Land | Improvement |
|---|---|---|---|---|
| 2025 | $5,505 | $545,000 | $208,000 | $337,000 |
| 2024 | $5,383 | $524,100 | $198,200 | $325,900 |
| 2023 | $5,118 | $489,800 | $183,500 | $306,300 |
| 2022 | $5,023 | $438,300 | $169,900 | $268,400 |
| 2021 | $4,455 | $379,500 | $169,900 | $209,600 |
| 2020 | $4,066 | $341,100 | $169,900 | $171,200 |
| 2019 | $3,916 | $323,100 | $163,400 | $159,700 |
| 2018 | $3,795 | $303,600 | $155,600 | $148,000 |
| 2017 | $3,597 | $280,800 | $148,200 | $132,600 |
| 2016 | $3,476 | $271,600 | $142,500 | $129,100 |
| 2015 | $3,373 | $261,500 | $142,500 | $119,000 |
| 2014 | $3,290 | $247,400 | $132,600 | $114,800 |
Source: Public Records
Map
Nearby Homes
- 54 Federal St
- 24 Blake Rd
- 33 Congress St
- 48 Apple Tree Ln
- 76 Kingman St
- 16 Lindbergh Ave
- 15 Summer St
- 23-25 Lindbergh Ave
- 19 Vine St Unit 3
- 19 Vine St Unit 1
- 114 Broad St Unit D
- 114 Broad St Unit C
- 200 Justin Dr Unit 3
- 11 Richmond St
- 122 Washington St Unit 22
- 286 Broad St
- 12 Klasson Ln
- 42 Sundin Rd
- 116 Belmont St
- 36 Brookside Rd