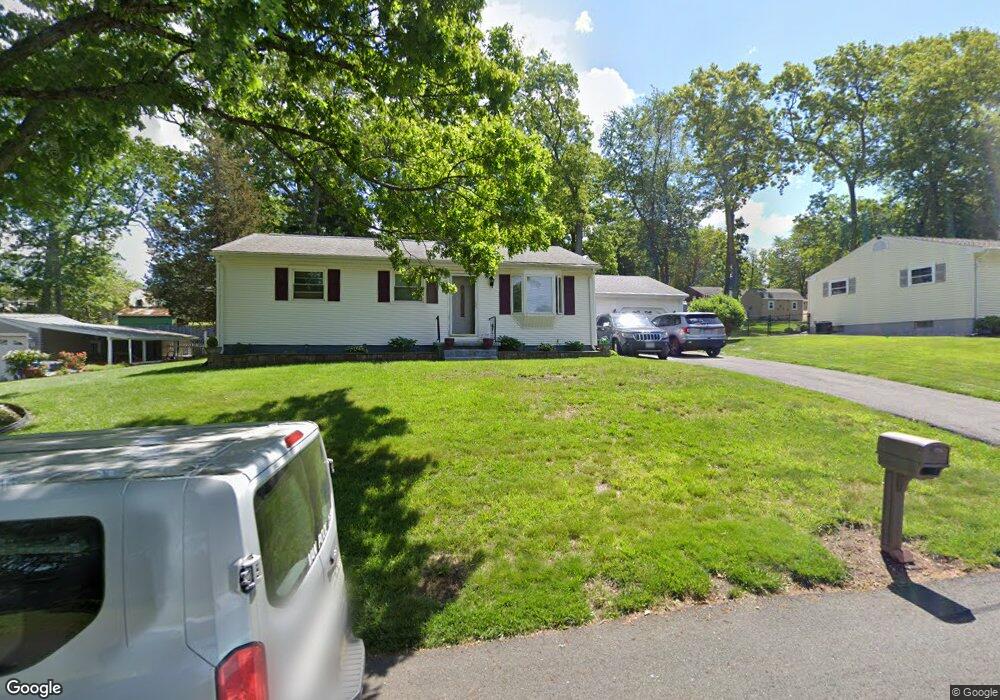
69 Feltham Rd Springfield, MA 01118
Sixteen Acres NeighborhoodEstimated Value: $308,000 - $347,000
3
Beds
2
Baths
1,647
Sq Ft
$197/Sq Ft
Est. Value
About This Home
This home is located at 69 Feltham Rd, Springfield, MA 01118 and is currently estimated at $324,102, approximately $196 per square foot. 69 Feltham Rd is a home located in Hampden County with nearby schools including Arthur T Talmadge Elementary School, M Marcus Kiley Middle, and Springfield High School of Science and Technology.
Ownership History
Date
Name
Owned For
Owner Type
Purchase Details
Closed on
Jul 30, 1997
Sold by
Lyman David E and Lyman Carol J
Bought by
Mckinney Joyce
Current Estimated Value
Home Financials for this Owner
Home Financials are based on the most recent Mortgage that was taken out on this home.
Original Mortgage
$87,060
Outstanding Balance
$13,061
Interest Rate
7.55%
Mortgage Type
Purchase Money Mortgage
Estimated Equity
$311,041
Create a Home Valuation Report for This Property
The Home Valuation Report is an in-depth analysis detailing your home's value as well as a comparison with similar homes in the area
Home Values in the Area
Average Home Value in this Area
Purchase History
| Date | Buyer | Sale Price | Title Company |
|---|---|---|---|
| Mckinney Joyce | $87,500 | -- |
Source: Public Records
Mortgage History
| Date | Status | Borrower | Loan Amount |
|---|---|---|---|
| Open | Mckinney Joyce | $87,060 | |
| Previous Owner | Mckinney Joyce | $25,000 | |
| Previous Owner | Mckinney Joyce | $22,000 |
Source: Public Records
Tax History
| Year | Tax Paid | Tax Assessment Tax Assessment Total Assessment is a certain percentage of the fair market value that is determined by local assessors to be the total taxable value of land and additions on the property. | Land | Improvement |
|---|---|---|---|---|
| 2025 | $3,738 | $238,400 | $59,500 | $178,900 |
| 2024 | $3,535 | $220,100 | $59,500 | $160,600 |
| 2023 | $3,108 | $182,300 | $56,700 | $125,600 |
| 2022 | $3,126 | $166,100 | $56,700 | $109,400 |
| 2021 | $2,933 | $155,200 | $51,500 | $103,700 |
| 2020 | $2,890 | $148,000 | $51,500 | $96,500 |
| 2019 | $2,824 | $143,500 | $51,500 | $92,000 |
| 2018 | $2,619 | $133,100 | $51,500 | $81,600 |
| 2017 | $2,729 | $138,800 | $51,500 | $87,300 |
| 2016 | $2,513 | $127,800 | $51,500 | $76,300 |
| 2015 | $2,563 | $130,300 | $51,500 | $78,800 |
Source: Public Records
Map
Nearby Homes
- 41 Hillside Dr
- 85 Talmadge Dr
- 86 Talmadge Dr
- 24 Wands St
- 25 Laurelwood Ln
- 17 Pebble Mill Rd
- 49 Corcoran Blvd
- 81 W Crystal Brook Dr
- 120 Bridle Path Rd
- 206 Treetop Ave
- 86 Wildwood Ave
- 55 Allen St
- 125 Manor Ct Unit 125
- 19 Manor Ct Unit 19
- 1962 Allen St
- 101 Regal St
- 46 Hadley St
- 65 Helen Cir
- 647 Plumtree Rd
- 137 Mapleshade Ave
Your Personal Tour Guide
Ask me questions while you tour the home.