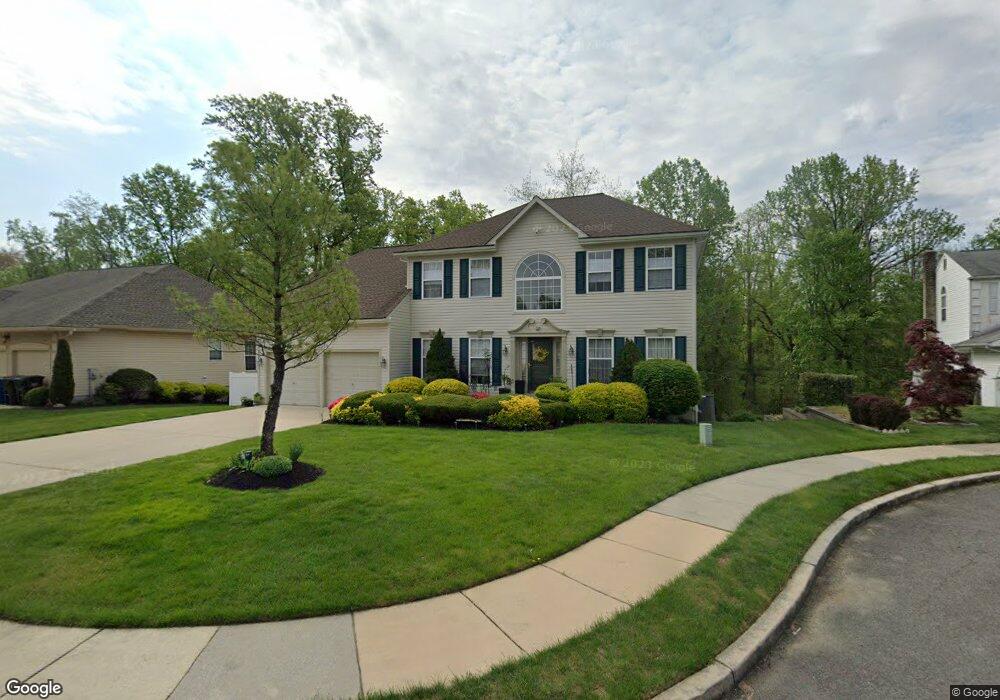
69 Flemish Way Lumberton, NJ 08048
Estimated Value: $651,615 - $700,000
4
Beds
3
Baths
2,624
Sq Ft
$260/Sq Ft
Est. Value
About This Home
This home is located at 69 Flemish Way, Lumberton, NJ 08048 and is currently estimated at $682,904, approximately $260 per square foot. 69 Flemish Way is a home located in Burlington County with nearby schools including Ashbrook Elementary School, Bobby’s Run School, and Lumberton Middle School.
Ownership History
Date
Name
Owned For
Owner Type
Purchase Details
Closed on
Sep 25, 2024
Sold by
Boama-Sefah John and Boama-Sefah Admira Ama
Bought by
John And Admira Boama-Sefah Revocable Living and Boama-Sefah
Current Estimated Value
Purchase Details
Closed on
May 26, 2000
Sold by
Miner Roger A and Miner Judy E
Bought by
Boama Sefah John and Boama Sefah Admira A
Home Financials for this Owner
Home Financials are based on the most recent Mortgage that was taken out on this home.
Original Mortgage
$227,700
Interest Rate
7.5%
Purchase Details
Closed on
Jun 1, 1999
Sold by
Peppertree Corp
Bought by
Miner Roger A and Miner Judy E
Home Financials for this Owner
Home Financials are based on the most recent Mortgage that was taken out on this home.
Original Mortgage
$199,635
Interest Rate
7.09%
Create a Home Valuation Report for This Property
The Home Valuation Report is an in-depth analysis detailing your home's value as well as a comparison with similar homes in the area
Home Values in the Area
Average Home Value in this Area
Purchase History
| Date | Buyer | Sale Price | Title Company |
|---|---|---|---|
| John And Admira Boama-Sefah Revocable Living | -- | None Listed On Document | |
| Boama Sefah John | $253,000 | -- | |
| Miner Roger A | $234,865 | Congress Title Corp |
Source: Public Records
Mortgage History
| Date | Status | Borrower | Loan Amount |
|---|---|---|---|
| Previous Owner | Boama Sefah John | $227,700 | |
| Previous Owner | Miner Roger A | $199,635 |
Source: Public Records
Tax History Compared to Growth
Tax History
| Year | Tax Paid | Tax Assessment Tax Assessment Total Assessment is a certain percentage of the fair market value that is determined by local assessors to be the total taxable value of land and additions on the property. | Land | Improvement |
|---|---|---|---|---|
| 2025 | $9,983 | $375,000 | $90,300 | $284,700 |
| 2024 | $9,386 | $375,000 | $90,300 | $284,700 |
| 2023 | $9,386 | $375,000 | $90,300 | $284,700 |
| 2022 | $9,169 | $375,000 | $90,300 | $284,700 |
| 2021 | $9,143 | $375,000 | $90,300 | $284,700 |
| 2020 | $9,064 | $375,000 | $90,300 | $284,700 |
| 2019 | $8,963 | $375,000 | $90,300 | $284,700 |
| 2018 | $8,828 | $375,000 | $90,300 | $284,700 |
| 2017 | $9,827 | $425,400 | $90,300 | $335,100 |
| 2016 | $9,614 | $425,400 | $90,300 | $335,100 |
| 2015 | $9,542 | $425,400 | $90,300 | $335,100 |
| 2014 | $9,180 | $425,400 | $90,300 | $335,100 |
Source: Public Records
Map
Nearby Homes
- 485 Main St
- 587 Main St
- 39 Bridge Rd
- 26 Chestnut St
- 5 Middleton Dr
- 15 Wellington Dr
- 71 Kingsbridge Dr
- 10 Whitehaven Dr
- 18 Westminster Dr
- 39 Tynemouth Dr
- 11 Abington Way
- 20 Jasmine Rd
- 511 Hamilton Ave
- 692 Eayrestown Rd
- 23 Creek Rd
- 50 Blue Spruce Ct
- 21 Mulberry Ct
- 44 Rockland Terrace
- 225 Ashley Ln
- 16 Basil Dr