
Seller's Agent in 2025
Liz Doll
William Raveis Real Estate
(860) 614-6078
6 in this area
177 Total Sales
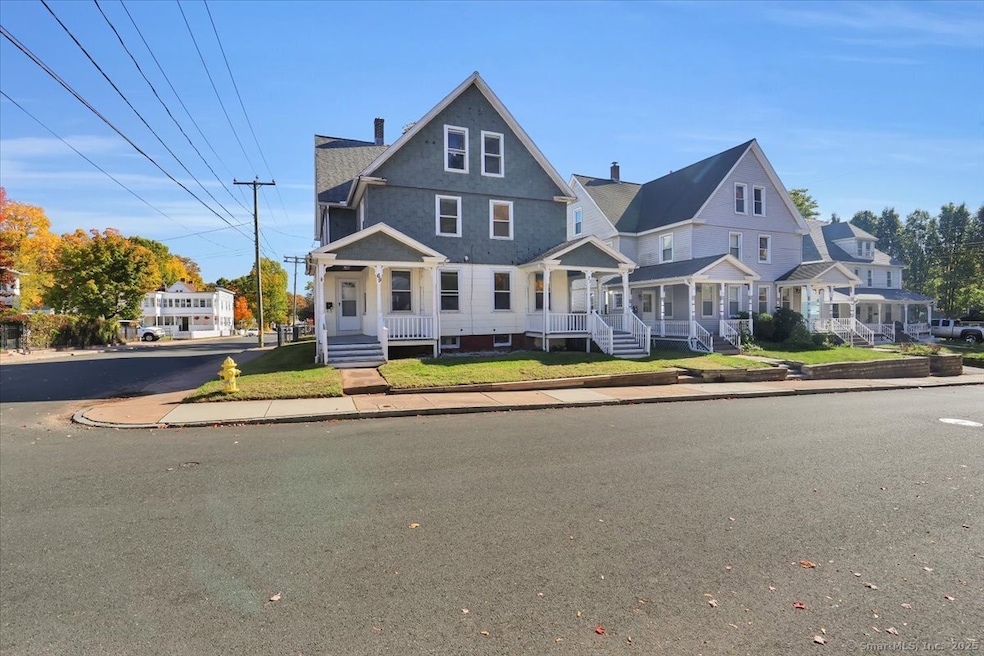
Downtown DARLING! 69-71 Foster Street is a classic mirror image multi with modern updates. Perfect for owner occupant or investor. This side-by-side 2 Family is located on a fenced-in corner lot and has 3 bedrooms, 1 and 1/2 bath in each unit. Both sides feature a large eat-in kitchen, formal dining room with built-in china cabinet, formal living room, and half bath / laundry room on the first floor. Upper levels have 3 bedrooms and 1 full bath. Full walk up attics and full basements as well as front and back covered porches. Natural gas heat and hot water, fresh interior paint.
Last Agent to Sell the Property
William Raveis Real Estate Brokerage Phone: (860) 614-6078 License #RES.0780779 Listed on: 10/22/2025
| Date | Type | Sale Price | Title Company |
|---|---|---|---|
| Warranty Deed | $450,000 | -- | |
| Quit Claim Deed | -- | -- | |
| Quit Claim Deed | -- | -- | |
| Warranty Deed | $230,000 | -- | |
| Warranty Deed | $230,000 | -- | |
| Warranty Deed | $37,500 | -- | |
| Executors Deed | $37,500 | -- | |
| Executors Deed | $37,500 | -- |
| Date | Status | Loan Amount | Loan Type |
|---|---|---|---|
| Open | $427,500 | New Conventional | |
| Previous Owner | $235,520 | FHA | |
| Previous Owner | $249,078 | No Value Available |
| Date | Event | Price | List to Sale | Price per Sq Ft |
|---|---|---|---|---|
| 12/05/2025 12/05/25 | Sold | $450,000 | +25.0% | $161 / Sq Ft |
| 12/05/2025 12/05/25 | Pending | -- | -- | -- |
| 10/22/2025 10/22/25 | For Sale | $359,900 | -- | $129 / Sq Ft |
| Year | Tax Paid | Tax Assessment Tax Assessment Total Assessment is a certain percentage of the fair market value that is determined by local assessors to be the total taxable value of land and additions on the property. | Land | Improvement |
|---|---|---|---|---|
| 2025 | $6,355 | $159,600 | $28,100 | $131,500 |
| 2024 | $6,173 | $159,600 | $28,100 | $131,500 |
| 2023 | $5,937 | $159,600 | $28,100 | $131,500 |
| 2022 | $5,765 | $159,600 | $28,100 | $131,500 |
| 2021 | $5,199 | $124,000 | $25,600 | $98,400 |
| 2020 | $5,192 | $124,000 | $25,600 | $98,400 |
| 2019 | $5,171 | $124,000 | $25,600 | $98,400 |
| 2018 | $5,073 | $124,000 | $25,600 | $98,400 |
| 2017 | $4,929 | $124,000 | $25,600 | $98,400 |
| 2016 | $4,829 | $121,700 | $33,100 | $88,600 |
| 2015 | $4,795 | $121,700 | $33,100 | $88,600 |
| 2014 | $4,704 | $121,700 | $33,100 | $88,600 |
Seller's Agent in 2025
Liz Doll
William Raveis Real Estate
(860) 614-6078
6 in this area
177 Total Sales
Buyer's Agent in 2025
Kristin Callahan
eXp Realty
(860) 938-4256
2 in this area
96 Total Sales
Source: SmartMLS
MLS Number: 24135009
APN: MANC-000094-002250-000069
Disclaimer: Certain information contained herein is derived from information provided by parties other than Homes.com. All information provided is deemed reliable, but is not guaranteed to be accurate and should be independently verified.
![]() IDX information is provided exclusively for personal, non-commercial use, and may not be used for any purpose other than to identify prospective properties consumers may be interested in purchasing. Information is deemed reliable but not guaranteed.
IDX information is provided exclusively for personal, non-commercial use, and may not be used for any purpose other than to identify prospective properties consumers may be interested in purchasing. Information is deemed reliable but not guaranteed.
Ask me questions while you tour the home.