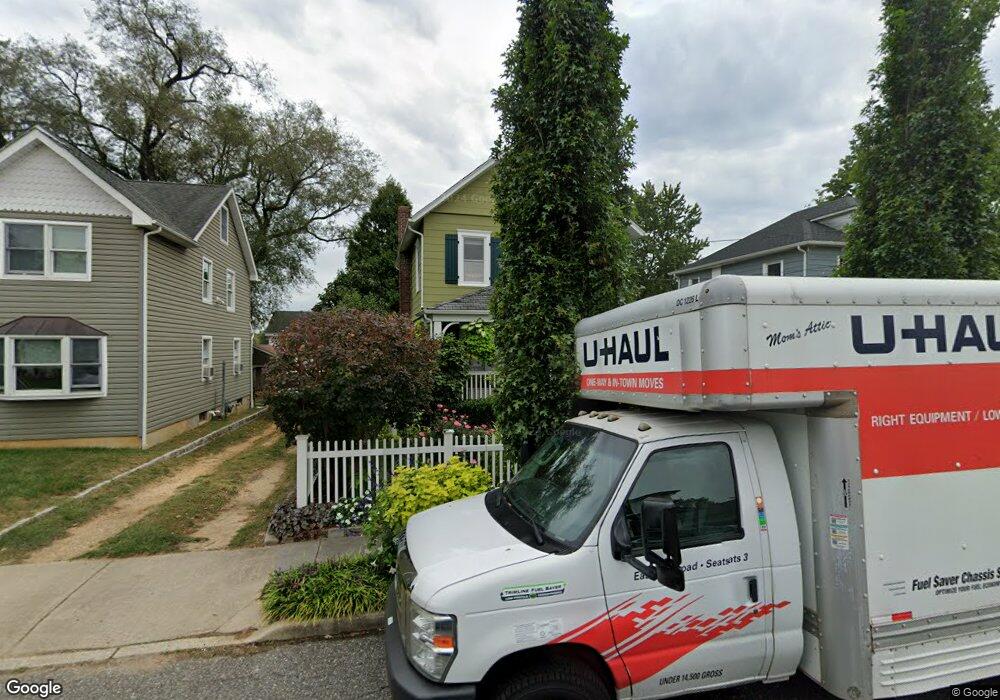
69 Foster St Red Bank, NJ 07701
New Monmouth NeighborhoodEstimated Value: $731,721 - $855,000
3
Beds
1
Bath
1,430
Sq Ft
$543/Sq Ft
Est. Value
About This Home
This home is located at 69 Foster St, Red Bank, NJ 07701 and is currently estimated at $776,930, approximately $543 per square foot. 69 Foster St is a home located in Monmouth County with nearby schools including River Plaza Elementary School, Thompson Middle School, and Middletown - South High School.
Ownership History
Date
Name
Owned For
Owner Type
Purchase Details
Closed on
Sep 20, 2011
Sold by
Ryskamp Kristine and Cavaliere Kristine
Bought by
Cavaliere Nicholas A and Cavaliere Kristine
Current Estimated Value
Home Financials for this Owner
Home Financials are based on the most recent Mortgage that was taken out on this home.
Original Mortgage
$313,500
Outstanding Balance
$215,399
Interest Rate
4.33%
Mortgage Type
New Conventional
Estimated Equity
$561,531
Purchase Details
Closed on
Sep 11, 2009
Sold by
Corcoran James J and Corcoran Marian E
Bought by
Ryskamp Kristine
Home Financials for this Owner
Home Financials are based on the most recent Mortgage that was taken out on this home.
Original Mortgage
$314,204
Interest Rate
5.14%
Mortgage Type
FHA
Create a Home Valuation Report for This Property
The Home Valuation Report is an in-depth analysis detailing your home's value as well as a comparison with similar homes in the area
Home Values in the Area
Average Home Value in this Area
Purchase History
| Date | Buyer | Sale Price | Title Company |
|---|---|---|---|
| Cavaliere Nicholas A | -- | First American Title Ins Co | |
| Ryskamp Kristine | $320,000 | Fidelity Natl Title Ins Co |
Source: Public Records
Mortgage History
| Date | Status | Borrower | Loan Amount |
|---|---|---|---|
| Open | Cavaliere Nicholas A | $313,500 | |
| Closed | Ryskamp Kristine | $314,204 |
Source: Public Records
Tax History Compared to Growth
Tax History
| Year | Tax Paid | Tax Assessment Tax Assessment Total Assessment is a certain percentage of the fair market value that is determined by local assessors to be the total taxable value of land and additions on the property. | Land | Improvement |
|---|---|---|---|---|
| 2025 | $10,319 | $683,900 | $465,500 | $218,400 |
| 2024 | $9,462 | $627,300 | $413,000 | $214,300 |
| 2023 | $9,462 | $544,400 | $366,300 | $178,100 |
| 2022 | $8,072 | $442,400 | $272,800 | $169,600 |
| 2021 | $8,072 | $388,100 | $237,300 | $150,800 |
| 2020 | $7,534 | $352,400 | $205,000 | $147,400 |
| 2019 | $6,978 | $330,400 | $205,000 | $125,400 |
| 2018 | $7,034 | $324,600 | $205,000 | $119,600 |
| 2017 | $6,816 | $320,900 | $205,000 | $115,900 |
| 2016 | $6,717 | $315,200 | $190,000 | $125,200 |
| 2015 | $6,731 | $315,100 | $190,000 | $125,100 |
| 2014 | $6,114 | $259,800 | $165,000 | $94,800 |
Source: Public Records
Map
Nearby Homes
- 13 Applegate St
- 928 Park Place
- 15 Hillside St
- 11 Buchhop Ln Unit 5
- 11 Buchhop Ln
- 7 Buchhop Ln
- 6 Buchhop Ln
- 74 Leighton Ave
- 33 Auburn Ct Unit G
- 121 Catherine St
- 167 River St
- 3 Auburn Ct
- 8 Cherry St
- 16 Concord Ct Unit 15D
- 159 Bridge Ave
- 22 Claremont Ct Unit 33E
- 171-173 Bridge Ave
- 79 Lake Shore Dr
- 7 Lexington Ct
- 11 Manchester Ct