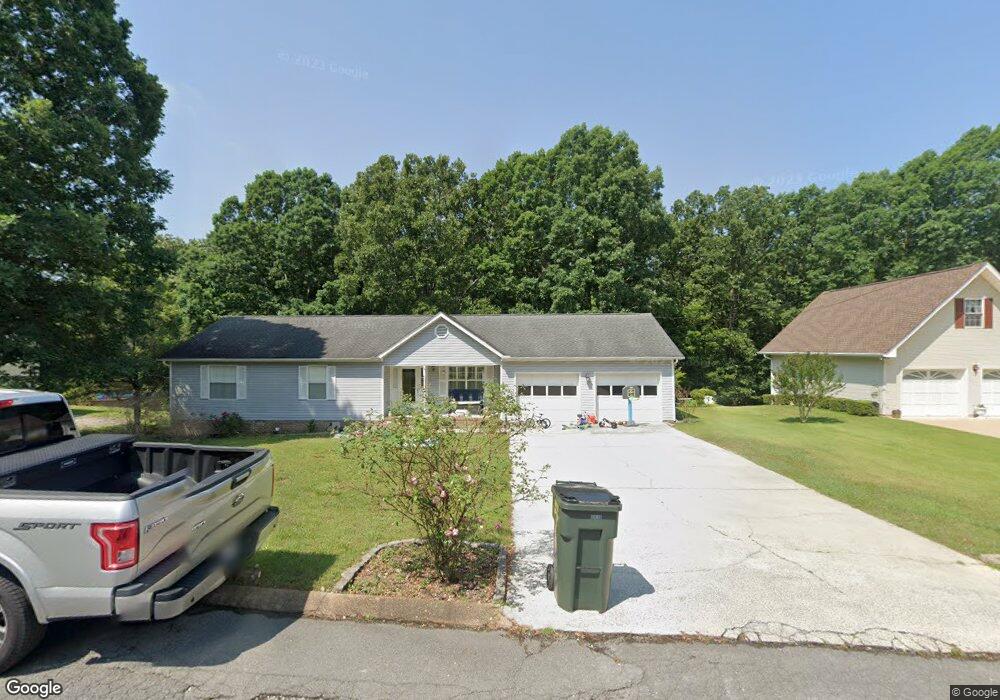
69 Fox Trot Dr Ringgold, GA 30736
Estimated Value: $272,944 - $324,000
--
Bed
2
Baths
1,440
Sq Ft
$205/Sq Ft
Est. Value
About This Home
This home is located at 69 Fox Trot Dr, Ringgold, GA 30736 and is currently estimated at $295,236, approximately $205 per square foot. 69 Fox Trot Dr is a home located in Catoosa County with nearby schools including Ringgold Primary School, Ringgold Elementary School, and Ringgold Middle School.
Ownership History
Date
Name
Owned For
Owner Type
Purchase Details
Closed on
May 23, 2014
Sold by
Payton Priscilla M Stroup
Bought by
Keel Anna G and Keel Phillip S
Current Estimated Value
Home Financials for this Owner
Home Financials are based on the most recent Mortgage that was taken out on this home.
Original Mortgage
$128,100
Outstanding Balance
$97,882
Interest Rate
4.4%
Mortgage Type
FHA
Estimated Equity
$197,354
Purchase Details
Closed on
Jul 17, 2007
Sold by
Not Provided
Bought by
Stroup Priscilla M
Home Financials for this Owner
Home Financials are based on the most recent Mortgage that was taken out on this home.
Original Mortgage
$130,852
Interest Rate
6.65%
Mortgage Type
New Conventional
Purchase Details
Closed on
Aug 1, 2006
Sold by
Vaughn Walter T
Bought by
The Walter T Vaughn Fam
Purchase Details
Closed on
May 5, 1994
Bought by
Vaughn Walter T
Create a Home Valuation Report for This Property
The Home Valuation Report is an in-depth analysis detailing your home's value as well as a comparison with similar homes in the area
Home Values in the Area
Average Home Value in this Area
Purchase History
| Date | Buyer | Sale Price | Title Company |
|---|---|---|---|
| Keel Anna G | $130,500 | -- | |
| Stroup Priscilla M | $135,000 | -- | |
| The Walter T Vaughn Fam | -- | -- | |
| Vaughn Walter T | $85,000 | -- |
Source: Public Records
Mortgage History
| Date | Status | Borrower | Loan Amount |
|---|---|---|---|
| Open | Keel Anna G | $128,100 | |
| Previous Owner | Stroup Priscilla M | $130,852 |
Source: Public Records
Tax History Compared to Growth
Tax History
| Year | Tax Paid | Tax Assessment Tax Assessment Total Assessment is a certain percentage of the fair market value that is determined by local assessors to be the total taxable value of land and additions on the property. | Land | Improvement |
|---|---|---|---|---|
| 2024 | $2,152 | $102,900 | $14,806 | $88,094 |
| 2023 | $1,793 | $82,092 | $14,806 | $67,286 |
| 2022 | $1,380 | $63,630 | $14,806 | $48,824 |
| 2021 | $1,290 | $63,630 | $14,806 | $48,824 |
| 2020 | $1,258 | $54,360 | $12,212 | $42,148 |
| 2019 | $1,196 | $53,138 | $10,990 | $42,148 |
| 2018 | $1,313 | $53,138 | $10,990 | $42,148 |
| 2017 | $1,250 | $52,606 | $10,990 | $41,616 |
| 2016 | $1,280 | $49,274 | $10,990 | $38,284 |
| 2015 | -- | $49,274 | $10,990 | $38,284 |
| 2014 | -- | $49,274 | $10,990 | $38,284 |
| 2013 | -- | $49,274 | $10,990 | $38,284 |
Source: Public Records
Map
Nearby Homes
- 75 Blue Bird Ln
- 223 Hickory Ridge Trail
- 219 Hickory Ridge Trail
- 11 Hickory Ridge Trail
- 8 Hickory Ridge Trail
- 0 Jacobs Rd
- 0 Sutton Dr Unit 1515453
- 115 Clear Creek Dr
- 7626 Nightengale Ct
- 1058 Woodgate Rd
- 316 Townsend Cir
- 49 Hillcrest Ct
- 451 N Three Notch Rd
- 0 Morrison Ln Unit 1522310
- 15 Pine St
- 4325 Highway 41
- 112 Gwen Dr
- 5283 Highway 41
- 00 Battlefield Pkwy
- 221 Hickory St
- 49 Fox Trot Dr Unit 3
- 49 Fox Trot Dr
- 95 Fox Trot Dr
- 72 Fox Trot Dr
- 149 Fox Trot Trail
- 167 Fox Trot Trail
- 112 Fox Trot Dr
- 207 Fox Trot Trail
- 86 Hickory Hollow Ln
- 144 Fox Trot Trail
- 172 Fox Trot Trail
- 114 Fox Trot Dr
- 112 Hickory Hollow Ln
- 198 Fox Trot Trail
- 130 Hickory Hollow Ln
- 218 Fox Trot Trail
- 0 Hickory Hollow Ln
- 49 Hickory Hollow Ln
- 92 Fox Trot Trail
- 241 Fox Trot Tr