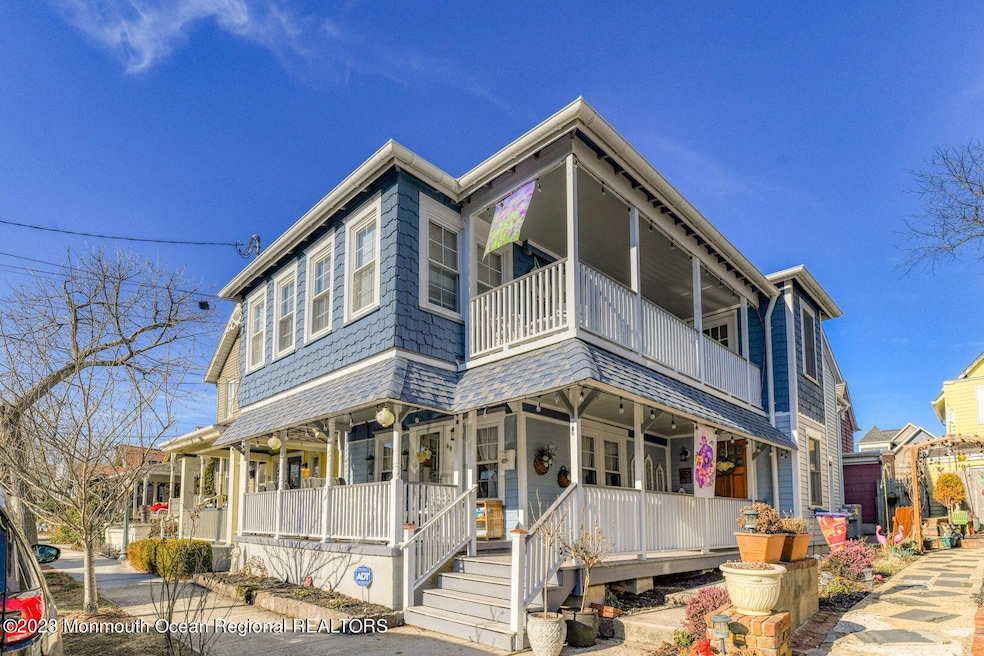
69 Franklin Ave Unit 2 Ocean Grove, NJ 07756
Highlights
- Water Views
- Multiple cooling system units
- Heating Available
- Furnished
- Living Room
- 4-minute walk to Ocean Grove Park
About This Home
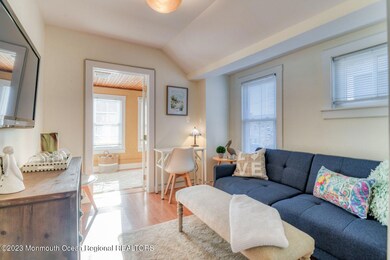
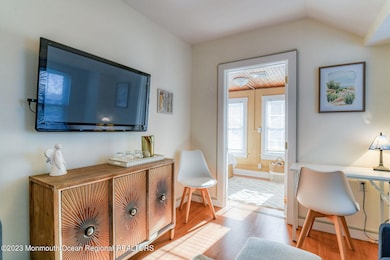
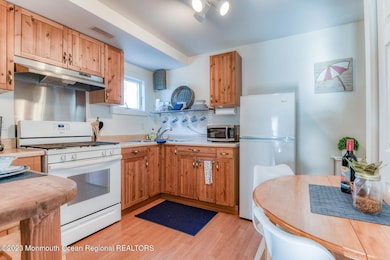
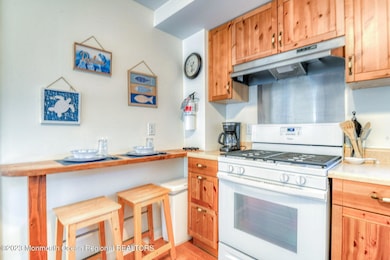
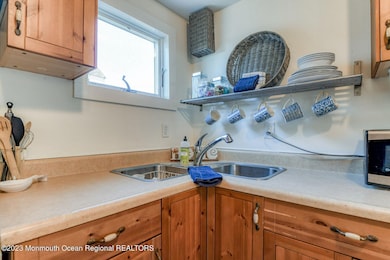
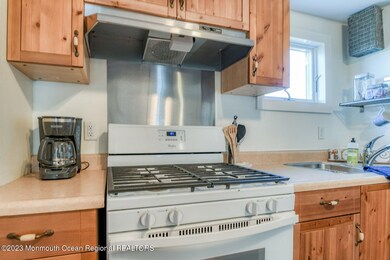
Totally adorable second floor WEEKLY SUMMER RENTAL. This two bedroom, one bath cutie is the perfect summer getaway. As you enter the apartment there is an upper porch with water views for warm summer evenings or morning coffee. The eat in kitchen is fully stocked with everything you need including the washer/dryer! Off the kitchen is a sweet living room with comfortable and stylish furnishings, plus a work space. This leads to the very sunny bedroom with Queen size bed and a reading nook. The second bedroom is sun filled and East facing and has a daybed with trundle. Full bath with tub/shower completes the package. Conveniently located few blocks to Beach, quaint town of Ocean Grove and minutes to Booming Asbury Park. Shared side yard with Grill and Two beach badges seals the deal Additional $200 Cleaning fee. NO SMOKING NO VAPING NO PETS
Property Details
Home Type
- Multi-Family
Est. Annual Taxes
- $16,386
Year Built
- Built in 1914
Parking
- No Garage
Home Design
- Duplex
Interior Spaces
- 2,096 Sq Ft Home
- 2-Story Property
- Furnished
- Living Room
- Water Views
Bedrooms and Bathrooms
- 2 Bedrooms
- 1 Full Bathroom
Schools
- Neptune Middle School
Utilities
- Multiple cooling system units
- Central Air
- Heating Available
Additional Features
- 1,742 Sq Ft Lot
- Upper Level
Community Details
- Ocean Grove Subdivision
Listing and Financial Details
- Security Deposit $1,000
- Weekly Lease Term
- Assessor Parcel Number 35-00267-0000-00015
Map
Source: MOREMLS (Monmouth Ocean Regional REALTORS®)
MLS Number: 22536254
APN: 35-00267-0000-00015
Disclaimer: Certain information contained herein is derived from information provided by parties other than Homes.com. All information provided is deemed reliable, but is not guaranteed to be accurate and should be independently verified.
![]() IDX information is provided exclusively for personal, non-commercial use, and may not be used for any purpose other than to identify prospective properties consumers may be interested in purchasing.
IDX information is provided exclusively for personal, non-commercial use, and may not be used for any purpose other than to identify prospective properties consumers may be interested in purchasing.
Information is deemed reliable but not guaranteed.
- 69 Stockton Ave
- 77 Stockton Ave
- 93 Central Ave
- 219 Lake Terrace
- 69 Webb Ave
- 217 Newark Ave
- 56 Embury Ave
- 52 Embury Ave
- 18 Abbott Ave
- 128 Broadway
- 20 Webb Ave
- 137 Inskip Ave
- 216 Ocean Park Ave Unit 1
- 212 Ocean Park Ave
- 66 Main Ave
- 139 Stockton Ave
- 140 Stockton Ave
- 139 Cookman Ave
- 210 Ocean Park Ave Unit 9
- 26 Heck Ave
- 69 Franklin Ave Unit 1
- 68 Clark Ave Unit 1E
- 68 Clark Ave Unit 2w
- 82 Franklin Ave
- 84 Cookman Ave
- 56 Franklin Ave
- 73 Cookman Ave Unit A
- 69 Cookman Ave
- 83 Cookman Ave
- 94 Clark Ave
- 87 Cookman Ave
- 113 Central Ave Unit 1
- 82 Inskip Ave
- 58 Broadway
- 88 Broadway
- 96 Cookman Ave
- 91 Cookman Ave
- 83 Broadway
- 64 Abbott Ave
- 42 Abbott Ave
