
Landlord's Agent in 2022
Thea Bowers
RE/MAX
(732) 361-0770
73 in this area
127 Total Sales


Estimated Value: $1,062,000 - $1,181,000
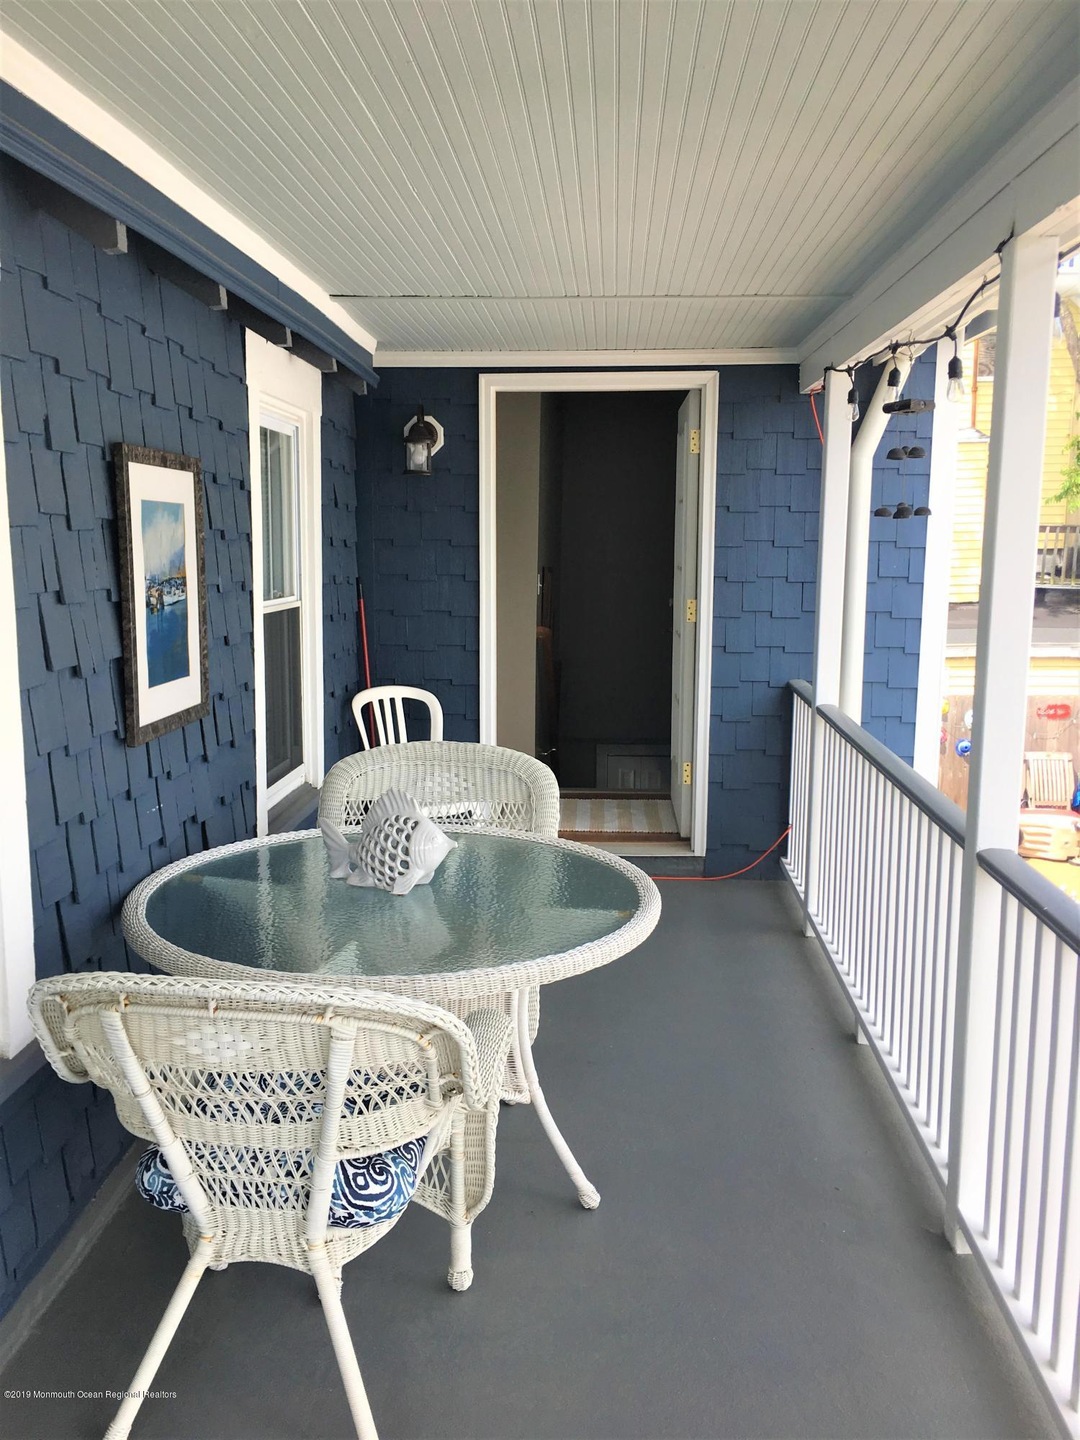
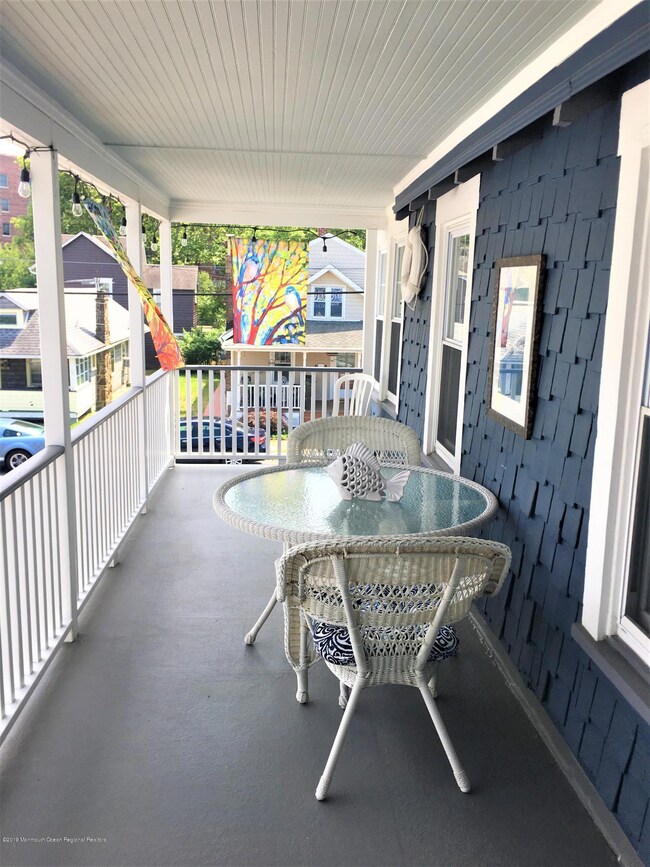
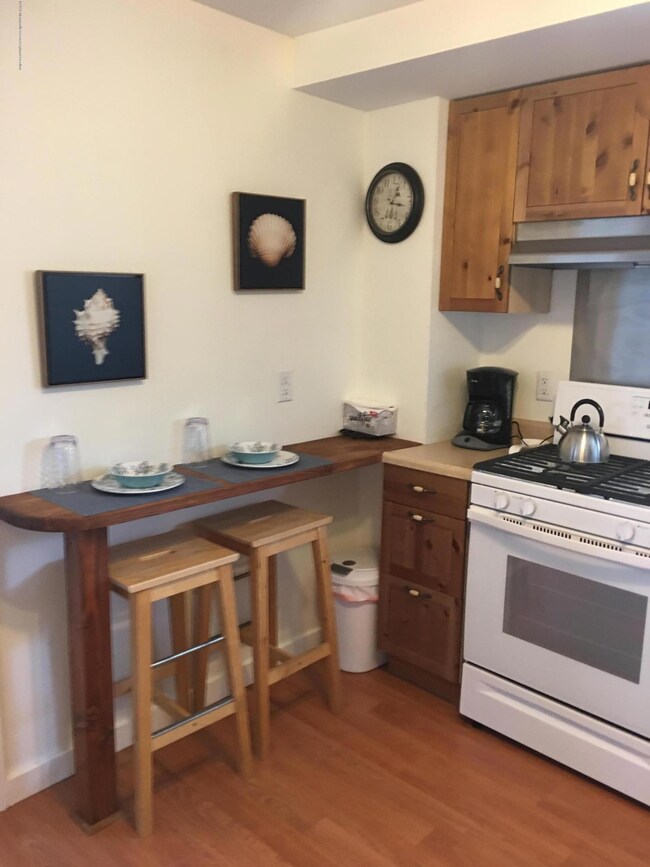
LAST TWO WEEKS 6/1-6/15, for $2700. This Pristine Summer Rental Has Everything You Need Including 2 Beach Badges, Linens, Cable, WIFI, Central Air, Washer/Dryer & Fabulous Private Balcony for Morning Coffee (Freshly Ground Starter Bag Courtesy of Landlord) or Apres Beach Relaxation. This Upper Unit Boasts a Beautiful 1BR w/Queen Bed & Bonus Room for Additional Guest, Fully Equipped Kitchen w/Lots of Accessories Including Picnic Bag for The Beach & Cozy Living Room w/TV. Full Bath w/Jacuzzi Tub & Shower. Sweet Outdoor Patio w/BBQ Available Too! Freshly Cut Bouquet of Flowers will Greet You Upon Arrival in This Lovingly Cared-For Rental. Dog Friendly (Well-Behaved & Case-By-Case). No Smoking. Cleaning Fee $150, $500 Security
Last Renter's Agent
Thea Bowers
C21/ Coastal Realtors
| Date | Buyer | Sale Price | Title Company |
|---|---|---|---|
| Hansen Eric | $50,000 | -- |
| Date | Status | Borrower | Loan Amount |
|---|---|---|---|
| Closed | Hansen Eric | $40,000 |
| Date | Event | Price | List to Sale | Price per Sq Ft |
|---|---|---|---|---|
| 05/05/2022 05/05/22 | Rented | $20,000 | +1381.5% | -- |
| 04/24/2022 04/24/22 | Under Contract | -- | -- | -- |
| 04/09/2022 04/09/22 | Price Changed | $1,350 | -50.0% | -- |
| 03/28/2022 03/28/22 | Price Changed | $2,700 | -46.0% | -- |
| 01/03/2022 01/03/22 | For Rent | $5,000 | -- | -- |
| Year | Tax Paid | Tax Assessment Tax Assessment Total Assessment is a certain percentage of the fair market value that is determined by local assessors to be the total taxable value of land and additions on the property. | Land | Improvement |
|---|---|---|---|---|
| 2025 | $16,386 | $1,048,200 | $518,100 | $530,100 |
| 2024 | $13,355 | $953,200 | $432,800 | $520,400 |
| 2023 | $13,355 | $752,800 | $425,800 | $327,000 |
| 2022 | $10,678 | $587,300 | $316,200 | $271,100 |
| 2021 | $9,249 | $514,100 | $305,700 | $208,400 |
| 2020 | $10,114 | $485,100 | $287,600 | $197,500 |
| 2019 | $9,249 | $437,700 | $252,400 | $185,300 |
| 2018 | $9,315 | $436,300 | $252,400 | $183,900 |
| 2017 | $9,278 | $416,800 | $246,500 | $170,300 |
| 2016 | $8,826 | $395,800 | $228,300 | $167,500 |
| 2015 | $9,069 | $414,100 | $250,600 | $163,500 |
| 2014 | $9,296 | $348,800 | $175,600 | $173,200 |
Landlord's Agent in 2022
Thea Bowers
RE/MAX
(732) 361-0770
73 in this area
127 Total Sales
Source: MOREMLS (Monmouth Ocean Regional REALTORS®)
MLS Number: 22200160
APN: 35-00267-0000-00015
Disclaimer: Certain information contained herein is derived from information provided by parties other than Homes.com. All information provided is deemed reliable, but is not guaranteed to be accurate and should be independently verified.
![]() IDX information is provided exclusively for personal, non-commercial use, and may not be used for any purpose other than to identify prospective properties consumers may be interested in purchasing.
IDX information is provided exclusively for personal, non-commercial use, and may not be used for any purpose other than to identify prospective properties consumers may be interested in purchasing.
Information is deemed reliable but not guaranteed.