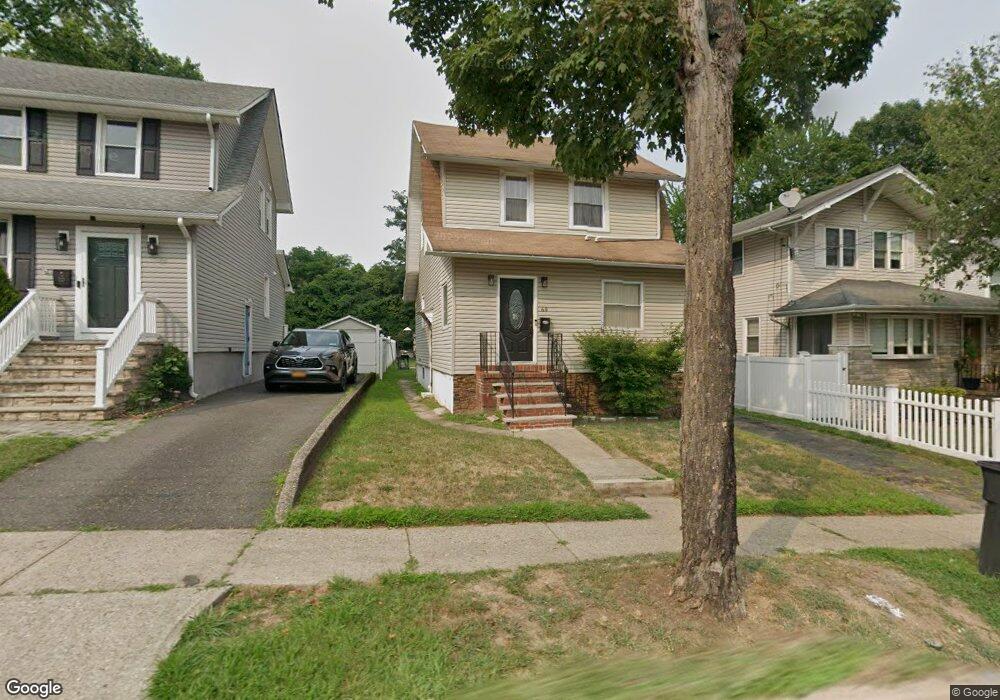
69 Franklin Rd Teaneck, NJ 07666
Estimated Value: $478,000 - $586,000
2
Beds
2
Baths
1,100
Sq Ft
$499/Sq Ft
Est. Value
About This Home
This home is located at 69 Franklin Rd, Teaneck, NJ 07666 and is currently estimated at $548,958, approximately $499 per square foot. 69 Franklin Rd is a home located in Bergen County with nearby schools including Teaneck Senior High School, Wilbert F Mays Seventh-Day Adventist School, and Yeshivat He'atid.
Ownership History
Date
Name
Owned For
Owner Type
Purchase Details
Closed on
Feb 28, 2003
Sold by
Singh Subhas S
Bought by
Pearson Benard
Current Estimated Value
Home Financials for this Owner
Home Financials are based on the most recent Mortgage that was taken out on this home.
Original Mortgage
$227,431
Outstanding Balance
$97,986
Interest Rate
5.91%
Mortgage Type
FHA
Estimated Equity
$450,972
Purchase Details
Closed on
Aug 30, 1999
Sold by
Ochoa Angel
Bought by
Singh Subhas S
Home Financials for this Owner
Home Financials are based on the most recent Mortgage that was taken out on this home.
Original Mortgage
$96,000
Interest Rate
7%
Mortgage Type
Stand Alone First
Purchase Details
Closed on
Apr 21, 1998
Sold by
Desouza Edward
Bought by
Ochoa Angel
Purchase Details
Closed on
Sep 19, 1997
Sold by
Monarch Svgs Bank Fsb
Bought by
Desouza Edward
Create a Home Valuation Report for This Property
The Home Valuation Report is an in-depth analysis detailing your home's value as well as a comparison with similar homes in the area
Home Values in the Area
Average Home Value in this Area
Purchase History
| Date | Buyer | Sale Price | Title Company |
|---|---|---|---|
| Pearson Benard | $231,000 | -- | |
| Singh Subhas S | $120,000 | Quest Title Agency Inc | |
| Ochoa Angel | $125,000 | Quest Title Agency Inc | |
| Desouza Edward | $62,000 | -- |
Source: Public Records
Mortgage History
| Date | Status | Borrower | Loan Amount |
|---|---|---|---|
| Open | Pearson Benard | $227,431 | |
| Previous Owner | Singh Subhas S | $96,000 |
Source: Public Records
Tax History
| Year | Tax Paid | Tax Assessment Tax Assessment Total Assessment is a certain percentage of the fair market value that is determined by local assessors to be the total taxable value of land and additions on the property. | Land | Improvement |
|---|---|---|---|---|
| 2025 | $8,885 | $406,800 | $206,500 | $200,300 |
| 2024 | $8,473 | $406,800 | $206,500 | $200,300 |
| 2023 | $8,306 | $256,600 | $130,800 | $125,800 |
| 2022 | $8,306 | $256,600 | $130,800 | $125,800 |
| 2021 | $8,204 | $256,600 | $130,800 | $125,800 |
| 2020 | $8,298 | $256,600 | $130,800 | $125,800 |
| 2019 | $8,204 | $256,600 | $130,800 | $125,800 |
| 2018 | $8,142 | $256,600 | $130,800 | $125,800 |
| 2017 | $8,065 | $256,600 | $130,800 | $125,800 |
| 2016 | $7,944 | $256,600 | $130,800 | $125,800 |
| 2015 | $7,819 | $256,600 | $130,800 | $125,800 |
| 2014 | $7,024 | $273,200 | $198,200 | $75,000 |
Source: Public Records
Map
Nearby Homes
- 81 Franklin Rd
- 51 Garden St
- 1329 Teaneck Rd
- 73 Fairview Ave
- 110 Fairview Ave
- 1449 Teaneck Rd
- 1485 Gaylord Terrace
- 1167 Arlington Ave
- 152 Washington Place
- 160 Pinewood Place
- 174 Manhattan Ave
- 208 Manhattan Ave
- 279 Genesee Ave
- 302 W Forest Ave
- 1096 Margaret St
- 1153 Queen Anne Rd
- 384 W Palisade Ave
- 137 Reade St
- 271 W Forest Ave
- 125 Reade St
Your Personal Tour Guide
Ask me questions while you tour the home.