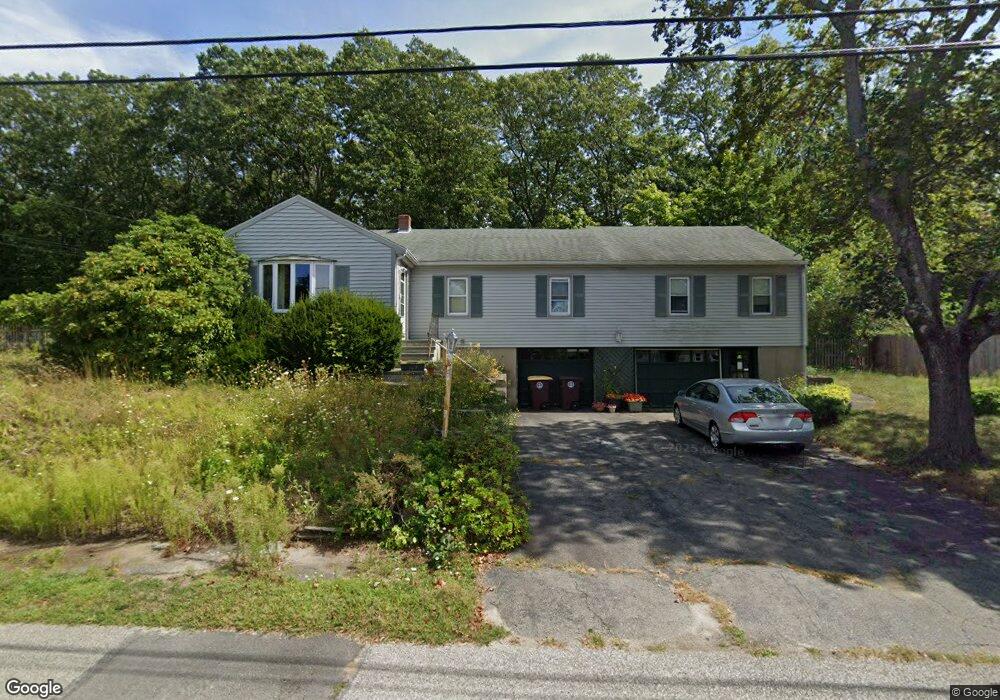
69 Gale Rd Weymouth, MA 02188
Weymouth Landing NeighborhoodEstimated Value: $627,000 - $749,000
4
Beds
2
Baths
1,680
Sq Ft
$401/Sq Ft
Est. Value
About This Home
This home is located at 69 Gale Rd, Weymouth, MA 02188 and is currently estimated at $673,755, approximately $401 per square foot. 69 Gale Rd is a home located in Norfolk County with nearby schools including Abigail Adams Middle School, William Seach Elementary School, and Weymouth Middle School Chapman.
Ownership History
Date
Name
Owned For
Owner Type
Purchase Details
Closed on
Nov 25, 2003
Sold by
Lownie Ann M
Bought by
Mori Andrea M
Current Estimated Value
Home Financials for this Owner
Home Financials are based on the most recent Mortgage that was taken out on this home.
Original Mortgage
$75,000
Outstanding Balance
$34,996
Interest Rate
5.98%
Mortgage Type
Purchase Money Mortgage
Estimated Equity
$638,759
Purchase Details
Closed on
Dec 16, 1996
Sold by
Mcdonnell John J and Mcdonnell Helen V
Bought by
Lownie Ann M
Create a Home Valuation Report for This Property
The Home Valuation Report is an in-depth analysis detailing your home's value as well as a comparison with similar homes in the area
Home Values in the Area
Average Home Value in this Area
Purchase History
| Date | Buyer | Sale Price | Title Company |
|---|---|---|---|
| Mori Andrea M | $375,000 | -- | |
| Lownie Ann M | $154,900 | -- |
Source: Public Records
Mortgage History
| Date | Status | Borrower | Loan Amount |
|---|---|---|---|
| Open | Lownie Ann M | $75,000 | |
| Previous Owner | Lownie Ann M | $16,400 | |
| Previous Owner | Lownie Ann M | $178,000 | |
| Previous Owner | Lownie Ann M | $30,100 |
Source: Public Records
Tax History Compared to Growth
Tax History
| Year | Tax Paid | Tax Assessment Tax Assessment Total Assessment is a certain percentage of the fair market value that is determined by local assessors to be the total taxable value of land and additions on the property. | Land | Improvement |
|---|---|---|---|---|
| 2025 | $5,529 | $547,400 | $206,800 | $340,600 |
| 2024 | $5,415 | $527,300 | $196,900 | $330,400 |
| 2023 | $5,160 | $493,800 | $182,300 | $311,500 |
| 2022 | $5,072 | $442,600 | $168,900 | $273,700 |
| 2021 | $4,799 | $408,800 | $168,900 | $239,900 |
| 2020 | $4,618 | $387,400 | $168,900 | $218,500 |
| 2019 | $4,438 | $366,200 | $162,400 | $203,800 |
| 2018 | $4,294 | $343,500 | $154,600 | $188,900 |
| 2017 | $4,200 | $327,900 | $147,300 | $180,600 |
| 2016 | $4,036 | $315,300 | $141,600 | $173,700 |
| 2015 | $3,866 | $299,700 | $141,600 | $158,100 |
| 2014 | $3,876 | $291,400 | $138,400 | $153,000 |
Source: Public Records
Map
Nearby Homes
- 42 Sundin Rd
- 286 Essex St
- 303 Middle St
- 12 Klasson Ln
- 29-31 Broad Street Place
- 367 Essex St
- 286 Broad St
- 449 Middle St
- 145 Jaffrey St
- 209 Lake St Unit 69
- 575 Broad St Unit 305
- 575 Broad St Unit 215
- 56 Putnam St
- 19 Vine St Unit 3
- 19 Vine St Unit 1
- 209 Lake Shore Dr
- 211 Lake Shore Dr
- 20 Richards Rd
- 669 Commercial St
- 114 Broad St Unit D