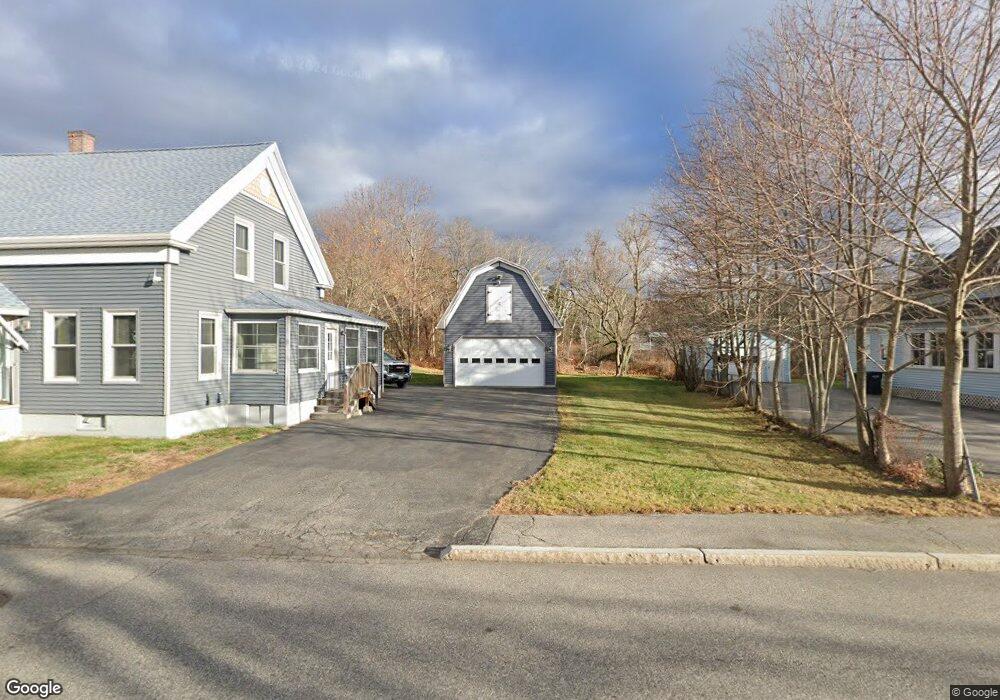
69 Granite St Biddeford, ME 04005
Estimated Value: $406,763 - $427,000
4
Beds
2
Baths
1,248
Sq Ft
$336/Sq Ft
Est. Value
About This Home
This home is located at 69 Granite St, Biddeford, ME 04005 and is currently estimated at $419,191, approximately $335 per square foot. 69 Granite St is a home located in York County with nearby schools including John F Kennedy Memorial School, Biddeford Primary School, and Biddeford Intermediate School.
Ownership History
Date
Name
Owned For
Owner Type
Purchase Details
Closed on
May 3, 2007
Sold by
Lapointe Tammy A
Bought by
Lapointe David P
Current Estimated Value
Home Financials for this Owner
Home Financials are based on the most recent Mortgage that was taken out on this home.
Original Mortgage
$189,000
Outstanding Balance
$112,497
Interest Rate
6.23%
Mortgage Type
Unknown
Estimated Equity
$306,694
Purchase Details
Closed on
Mar 5, 2007
Sold by
Lapointe Tammy A
Bought by
Lapointe David P
Home Financials for this Owner
Home Financials are based on the most recent Mortgage that was taken out on this home.
Original Mortgage
$189,000
Outstanding Balance
$112,497
Interest Rate
6.23%
Mortgage Type
Unknown
Estimated Equity
$306,694
Create a Home Valuation Report for This Property
The Home Valuation Report is an in-depth analysis detailing your home's value as well as a comparison with similar homes in the area
Home Values in the Area
Average Home Value in this Area
Purchase History
| Date | Buyer | Sale Price | Title Company |
|---|---|---|---|
| Lapointe David P | -- | -- | |
| Lapointe David P | -- | -- |
Source: Public Records
Mortgage History
| Date | Status | Borrower | Loan Amount |
|---|---|---|---|
| Open | Lapointe David P | $189,000 | |
| Previous Owner | Lapointe David P | $189,000 | |
| Previous Owner | Lapointe David P | $47,368 |
Source: Public Records
Tax History
| Year | Tax Paid | Tax Assessment Tax Assessment Total Assessment is a certain percentage of the fair market value that is determined by local assessors to be the total taxable value of land and additions on the property. | Land | Improvement |
|---|---|---|---|---|
| 2024 | $4,391 | $308,800 | $145,700 | $163,100 |
| 2023 | $4,017 | $306,200 | $143,100 | $163,100 |
| 2022 | $3,617 | $220,400 | $80,700 | $139,700 |
| 2021 | $3,458 | $189,700 | $68,200 | $121,500 |
| 2020 | $3,529 | $176,000 | $62,000 | $114,000 |
| 2019 | $3,950 | $176,000 | $62,000 | $114,000 |
| 2018 | $3,467 | $176,000 | $62,000 | $114,000 |
| 2017 | $3,382 | $168,500 | $62,000 | $106,500 |
| 2016 | $3,346 | $168,500 | $62,000 | $106,500 |
| 2015 | $3,004 | $164,300 | $62,000 | $102,300 |
| 2014 | $2,691 | $151,700 | $62,000 | $89,700 |
| 2013 | -- | $153,900 | $59,100 | $94,800 |
Source: Public Records
Map
Nearby Homes
Your Personal Tour Guide
Ask me questions while you tour the home.