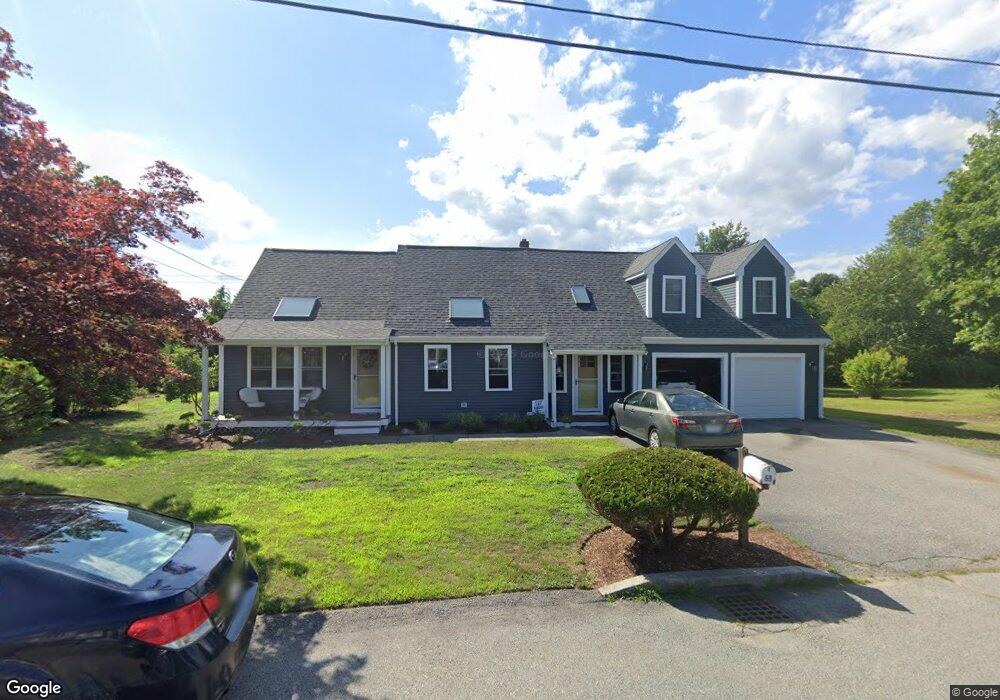
69 Gregory Dr Attleboro, MA 02703
Estimated Value: $555,000 - $652,000
3
Beds
2
Baths
1,723
Sq Ft
$350/Sq Ft
Est. Value
About This Home
This home is located at 69 Gregory Dr, Attleboro, MA 02703 and is currently estimated at $603,702, approximately $350 per square foot. 69 Gregory Dr is a home located in Bristol County with nearby schools including Peter Thacher Elementary School, Robert J. Coelho Middle School, and Attleboro High School.
Ownership History
Date
Name
Owned For
Owner Type
Purchase Details
Closed on
Dec 18, 2001
Sold by
Caruthers Marc M and Caruthers Rebecca L
Bought by
Rosen Jeffrey S and Rosen Jennifer M
Current Estimated Value
Home Financials for this Owner
Home Financials are based on the most recent Mortgage that was taken out on this home.
Original Mortgage
$247,000
Outstanding Balance
$92,515
Interest Rate
6.6%
Mortgage Type
Purchase Money Mortgage
Estimated Equity
$511,188
Purchase Details
Closed on
Jan 3, 1994
Sold by
Cedar Ridge Dev Inc
Bought by
Caruthers Marc M and Bryden Rebecca L
Create a Home Valuation Report for This Property
The Home Valuation Report is an in-depth analysis detailing your home's value as well as a comparison with similar homes in the area
Home Values in the Area
Average Home Value in this Area
Purchase History
| Date | Buyer | Sale Price | Title Company |
|---|---|---|---|
| Rosen Jeffrey S | $260,000 | -- | |
| Caruthers Marc M | $104,630 | -- |
Source: Public Records
Mortgage History
| Date | Status | Borrower | Loan Amount |
|---|---|---|---|
| Open | Caruthers Marc M | $247,000 | |
| Previous Owner | Caruthers Marc M | $168,726 | |
| Previous Owner | Caruthers Marc M | $45,000 |
Source: Public Records
Tax History
| Year | Tax Paid | Tax Assessment Tax Assessment Total Assessment is a certain percentage of the fair market value that is determined by local assessors to be the total taxable value of land and additions on the property. | Land | Improvement |
|---|---|---|---|---|
| 2025 | $7,048 | $561,600 | $167,800 | $393,800 |
| 2024 | $6,668 | $523,800 | $151,000 | $372,800 |
| 2023 | $6,652 | $485,900 | $152,700 | $333,200 |
| 2022 | $6,326 | $437,800 | $145,400 | $292,400 |
| 2021 | $5,448 | $368,100 | $139,900 | $228,200 |
| 2020 | $5,367 | $368,600 | $133,600 | $235,000 |
| 2019 | $4,694 | $331,500 | $131,200 | $200,300 |
| 2018 | $3,534 | $322,600 | $127,400 | $195,200 |
| 2017 | $4,967 | $341,400 | $124,300 | $217,100 |
| 2016 | $4,575 | $308,700 | $115,900 | $192,800 |
| 2015 | $4,206 | $285,900 | $115,900 | $170,000 |
| 2014 | $3,848 | $259,100 | $110,800 | $148,300 |
Source: Public Records
Map
Nearby Homes
- 27 Tiffany St
- 87 Tanglewood Dr
- 124 Tiffany St
- 0 Joseph St Unit 73469304
- 0 Tulip Unit 73475130
- 855 County St Unit 2
- 138 Fisher St Unit A
- 138 Fisher St Unit B
- 357 Tiffany St
- 19 Beech St
- 78 Saveena Dr
- 74 Saveena Dr
- 96 Mary Rocha Way
- 19 York Dr
- 52 Carpenter St
- 58 Saveena Dr
- 51 Saveena Dr
- 17 Crawford Ave
- Lot B Burnside Ave
- 17 Jewel Ave
Your Personal Tour Guide
Ask me questions while you tour the home.