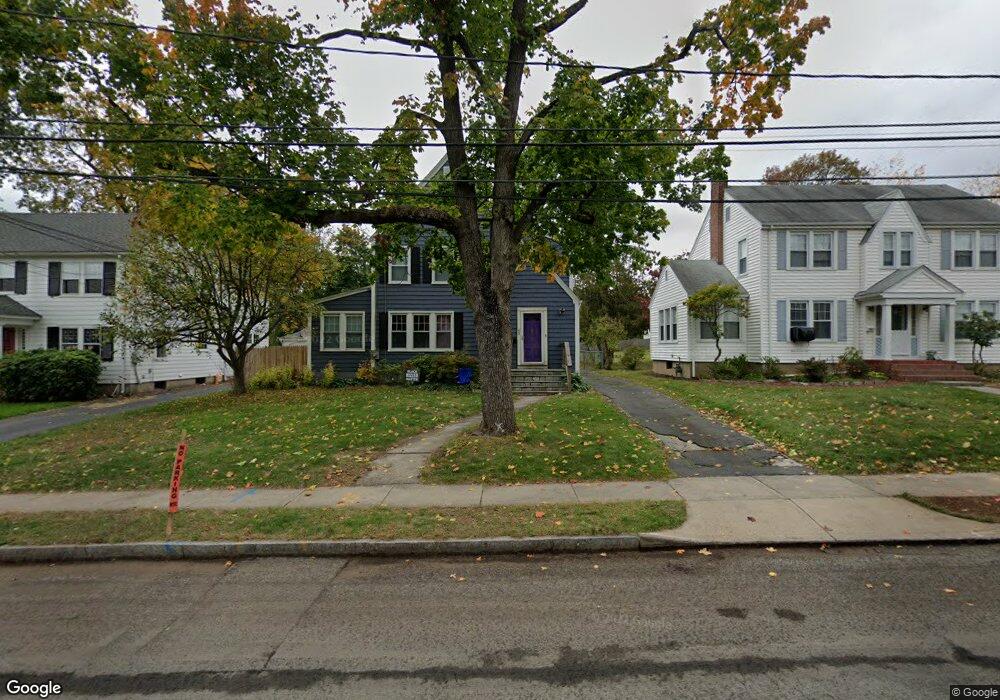
69 Grennan Rd West Hartford, CT 06107
Estimated Value: $645,305 - $750,000
4
Beds
2
Baths
2,187
Sq Ft
$312/Sq Ft
Est. Value
About This Home
This home is located at 69 Grennan Rd, West Hartford, CT 06107 and is currently estimated at $681,326, approximately $311 per square foot. 69 Grennan Rd is a home located in Hartford County with nearby schools including Braeburn School, Sedgwick Middle School, and Conard High School.
Ownership History
Date
Name
Owned For
Owner Type
Purchase Details
Closed on
Oct 29, 2013
Sold by
Duff Michael O
Bought by
Papoulis Irene E
Current Estimated Value
Home Financials for this Owner
Home Financials are based on the most recent Mortgage that was taken out on this home.
Original Mortgage
$228,000
Outstanding Balance
$172,232
Interest Rate
4.56%
Mortgage Type
New Conventional
Estimated Equity
$509,094
Purchase Details
Closed on
Sep 27, 1999
Sold by
Normandin Jill M
Bought by
Papoulis Irene E and Duff Michael O
Home Financials for this Owner
Home Financials are based on the most recent Mortgage that was taken out on this home.
Original Mortgage
$170,000
Interest Rate
7.38%
Purchase Details
Closed on
Jul 14, 1998
Sold by
Pagani Darlene R and Pagani Herbert F
Bought by
Normandin Jill M
Create a Home Valuation Report for This Property
The Home Valuation Report is an in-depth analysis detailing your home's value as well as a comparison with similar homes in the area
Home Values in the Area
Average Home Value in this Area
Purchase History
| Date | Buyer | Sale Price | Title Company |
|---|---|---|---|
| Papoulis Irene E | -- | -- | |
| Papoulis Irene E | $220,000 | -- | |
| Normandin Jill M | $185,000 | -- |
Source: Public Records
Mortgage History
| Date | Status | Borrower | Loan Amount |
|---|---|---|---|
| Open | Normandin Jill M | $100,000 | |
| Open | Papoulis Irene E | $228,000 | |
| Previous Owner | Normandin Jill M | $156,000 | |
| Previous Owner | Normandin Jill M | $170,000 |
Source: Public Records
Tax History Compared to Growth
Tax History
| Year | Tax Paid | Tax Assessment Tax Assessment Total Assessment is a certain percentage of the fair market value that is determined by local assessors to be the total taxable value of land and additions on the property. | Land | Improvement |
|---|---|---|---|---|
| 2025 | $13,184 | $294,420 | $144,270 | $150,150 |
| 2024 | $12,469 | $294,420 | $144,270 | $150,150 |
| 2023 | $12,048 | $294,420 | $144,270 | $150,150 |
| 2022 | $11,977 | $294,420 | $144,270 | $150,150 |
| 2021 | $11,527 | $271,740 | $140,210 | $131,530 |
| 2020 | $11,022 | $263,690 | $136,010 | $127,680 |
| 2019 | $10,610 | $253,820 | $136,010 | $117,810 |
| 2018 | $10,407 | $253,820 | $136,010 | $117,810 |
| 2017 | $10,457 | $254,800 | $136,010 | $118,790 |
| 2016 | $9,481 | $239,960 | $102,130 | $137,830 |
| 2015 | $9,193 | $239,960 | $102,130 | $137,830 |
| 2014 | $8,967 | $239,960 | $102,130 | $137,830 |
Source: Public Records
Map
Nearby Homes
- 2 Arapahoe Rd Unit 308
- 2 Arapahoe Rd Unit 415
- 2 Arapahoe Rd Unit 611
- 2 Arapahoe Rd Unit 613
- 2 Arapahoe Rd Unit 311
- 2 Arapahoe Rd Unit 312
- 2 Arapahoe Rd Unit 510
- 2 Arapahoe Rd Unit 610
- 2 Arapahoe Rd Unit 609
- 2 Arapahoe Rd Unit 606
- 2 Arapahoe Rd Unit 505
- 2 Arapahoe Rd Unit 605
- 2 Arapahoe Rd Unit 313
- 2 Arapahoe Rd Unit 604
- 2 Arapahoe Rd Unit 607
- 2 Arapahoe Rd Unit 603
- 2 Arapahoe Rd Unit 602
- 2 Arapahoe Rd Unit 612
- 2 Arapahoe Rd Unit 515
- 2 Arapahoe Rd Unit 601