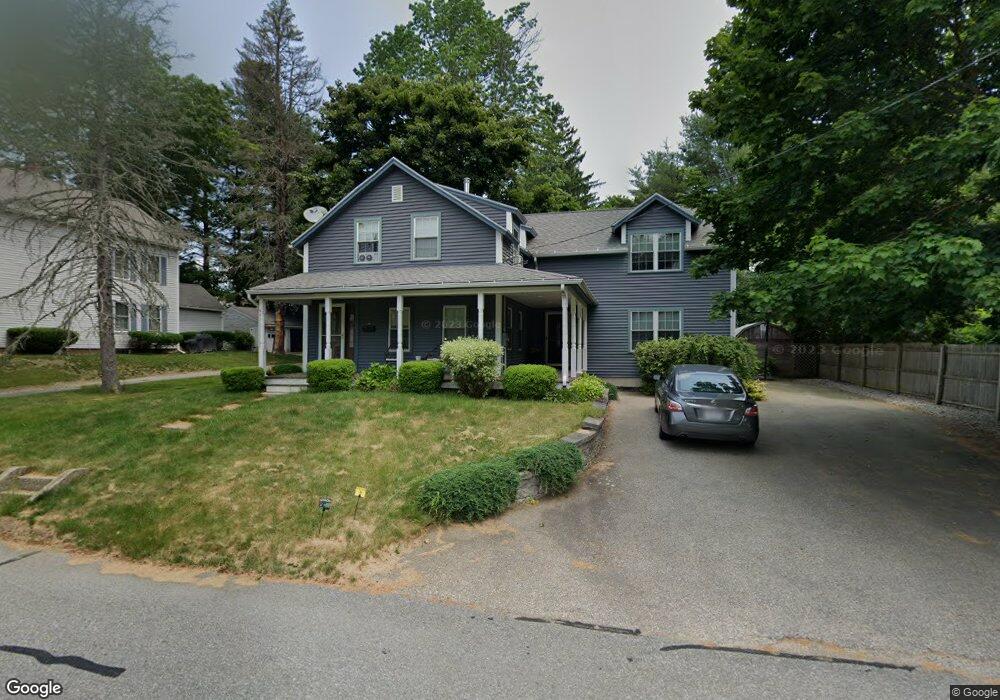
69 Grove St Leicester, MA 01524
Estimated Value: $422,000 - $518,000
4
Beds
3
Baths
2,155
Sq Ft
$220/Sq Ft
Est. Value
About This Home
This home is located at 69 Grove St, Leicester, MA 01524 and is currently estimated at $474,264, approximately $220 per square foot. 69 Grove St is a home located in Worcester County with nearby schools including Leicester Integrated Preschool, Leicester Memorial Elementary School, and Leicester Middle School.
Ownership History
Date
Name
Owned For
Owner Type
Purchase Details
Closed on
Oct 31, 2019
Sold by
Soucie Norman A and Soucie Carissa M
Bought by
Soucie Norman A
Current Estimated Value
Home Financials for this Owner
Home Financials are based on the most recent Mortgage that was taken out on this home.
Original Mortgage
$178,500
Outstanding Balance
$156,852
Interest Rate
3.65%
Mortgage Type
New Conventional
Estimated Equity
$317,412
Purchase Details
Closed on
Dec 11, 2006
Sold by
Soucie Norman A
Bought by
Soucie Carissa M and Soucie Norman A
Purchase Details
Closed on
Jun 2, 2006
Sold by
Soucie Norman A Sr Est and Gallant
Bought by
Soucie Norman A
Create a Home Valuation Report for This Property
The Home Valuation Report is an in-depth analysis detailing your home's value as well as a comparison with similar homes in the area
Home Values in the Area
Average Home Value in this Area
Purchase History
| Date | Buyer | Sale Price | Title Company |
|---|---|---|---|
| Soucie Norman A | -- | -- | |
| Soucie Norman A | -- | -- | |
| Soucie Norman A | -- | -- | |
| Soucie Carissa M | -- | -- | |
| Soucie Carissa M | -- | -- | |
| Soucie Carissa M | -- | -- | |
| Soucie Norman A | -- | -- | |
| Soucie Norman A | -- | -- | |
| Soucie Norman A | -- | -- |
Source: Public Records
Mortgage History
| Date | Status | Borrower | Loan Amount |
|---|---|---|---|
| Open | Soucie Norman A | $178,500 | |
| Closed | Soucie Norman A | $178,500 | |
| Previous Owner | Soucie Norman A | $165,000 | |
| Previous Owner | Soucie Norman A | $25,000 |
Source: Public Records
Tax History Compared to Growth
Tax History
| Year | Tax Paid | Tax Assessment Tax Assessment Total Assessment is a certain percentage of the fair market value that is determined by local assessors to be the total taxable value of land and additions on the property. | Land | Improvement |
|---|---|---|---|---|
| 2025 | $49 | $415,200 | $61,600 | $353,600 |
| 2024 | $4,644 | $370,000 | $54,000 | $316,000 |
| 2023 | $4,389 | $341,300 | $54,000 | $287,300 |
| 2022 | $4,211 | $301,000 | $51,200 | $249,800 |
| 2021 | $4,515 | $298,400 | $54,000 | $244,400 |
| 2020 | $3,869 | $259,500 | $47,300 | $212,200 |
| 2019 | $3,622 | $240,200 | $42,600 | $197,600 |
| 2018 | $3,577 | $222,300 | $42,600 | $179,700 |
| 2017 | $3,441 | $222,300 | $42,600 | $179,700 |
| 2016 | $3,171 | $212,800 | $53,200 | $159,600 |
| 2015 | $3,094 | $212,800 | $53,200 | $159,600 |
Source: Public Records
Map
Nearby Homes
- 0 S Main St Unit 73392435
- 68 Pine St
- 1003 Main St
- 997 Main St
- 993 Main St
- 68 Lake Ave
- 80 Rawson St
- 1326 Main St
- 0 Hawthorne St Unit 73444632
- 27 Winslow Ave
- 1472 Main St
- 1569 Main St
- 502 Pine St
- 19 Laurelwood Ave
- 10 Conway Dr
- 135 Henshaw St
- 500 Main St
- Lot A Paxton St
- 164 Peter Salem Rd
- 6 Pitcairn Ave