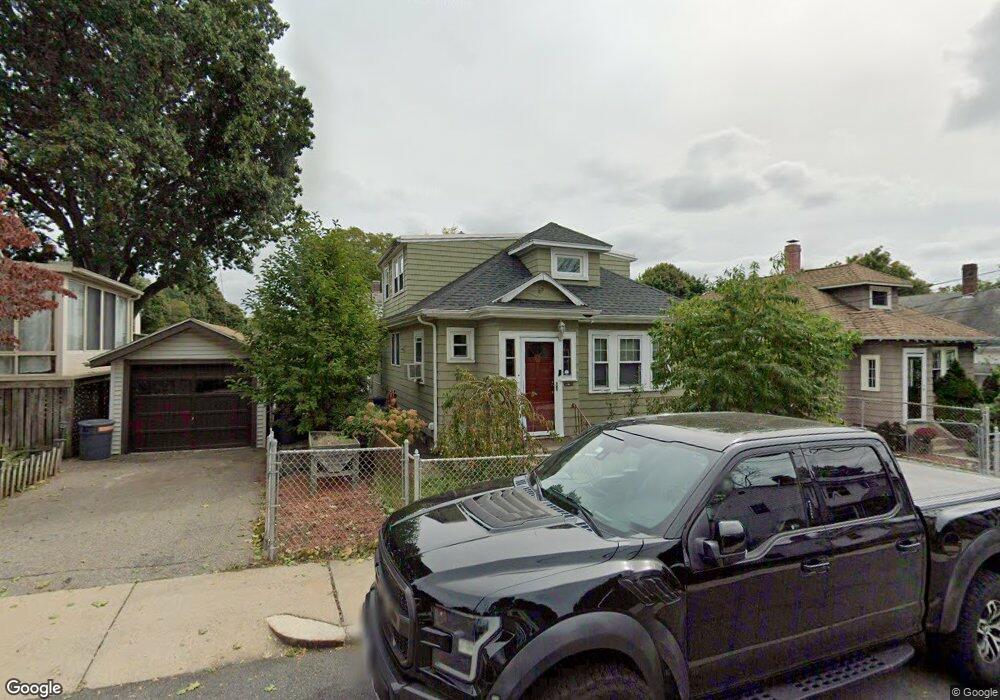
69 Halliday St Roslindale, MA 02131
Jamaica Plain NeighborhoodEstimated Value: $711,975 - $726,000
3
Beds
1
Bath
1,356
Sq Ft
$529/Sq Ft
Est. Value
About This Home
This home is located at 69 Halliday St, Roslindale, MA 02131 and is currently estimated at $717,994, approximately $529 per square foot. 69 Halliday St is a home located in Suffolk County with nearby schools including Brooke Charter School Roslindale and St. Clare High School.
Ownership History
Date
Name
Owned For
Owner Type
Purchase Details
Closed on
Mar 4, 2020
Sold by
Cabral Ana M
Bought by
Rosario and Cabral Ana
Current Estimated Value
Home Financials for this Owner
Home Financials are based on the most recent Mortgage that was taken out on this home.
Original Mortgage
$403,750
Outstanding Balance
$274,769
Interest Rate
3.4%
Mortgage Type
New Conventional
Estimated Equity
$443,225
Purchase Details
Closed on
Mar 19, 2010
Sold by
Mcnamara Thomas A
Bought by
Cabral Ana M
Home Financials for this Owner
Home Financials are based on the most recent Mortgage that was taken out on this home.
Original Mortgage
$295,000
Interest Rate
5.05%
Mortgage Type
Purchase Money Mortgage
Create a Home Valuation Report for This Property
The Home Valuation Report is an in-depth analysis detailing your home's value as well as a comparison with similar homes in the area
Home Values in the Area
Average Home Value in this Area
Purchase History
| Date | Buyer | Sale Price | Title Company |
|---|---|---|---|
| Rosario | -- | None Available | |
| Cabral Ana M | $295,000 | -- | |
| Cabral Ana M | $295,000 | -- |
Source: Public Records
Mortgage History
| Date | Status | Borrower | Loan Amount |
|---|---|---|---|
| Open | Rosario | $403,750 | |
| Previous Owner | Cabral Ana M | $295,000 |
Source: Public Records
Tax History Compared to Growth
Tax History
| Year | Tax Paid | Tax Assessment Tax Assessment Total Assessment is a certain percentage of the fair market value that is determined by local assessors to be the total taxable value of land and additions on the property. | Land | Improvement |
|---|---|---|---|---|
| 2025 | $6,584 | $568,600 | $168,900 | $399,700 |
| 2024 | $6,299 | $577,900 | $172,100 | $405,800 |
| 2023 | $5,799 | $539,900 | $160,800 | $379,100 |
| 2022 | $5,388 | $495,200 | $147,500 | $347,700 |
| 2021 | $5,130 | $480,800 | $143,200 | $337,600 |
| 2020 | $4,634 | $438,800 | $144,900 | $293,900 |
| 2019 | $4,407 | $418,100 | $118,600 | $299,500 |
| 2018 | $3,911 | $373,200 | $118,600 | $254,600 |
| 2017 | $3,877 | $366,100 | $118,600 | $247,500 |
| 2016 | $3,948 | $358,900 | $118,600 | $240,300 |
| 2015 | $3,864 | $319,100 | $133,900 | $185,200 |
| 2014 | $3,515 | $279,400 | $133,900 | $145,500 |
Source: Public Records
Map
Nearby Homes
- 24 Waterman Rd
- 105 Neponset Ave Unit 105
- 103 Neponset Ave Unit 103A
- 103-105 Neponset Ave
- 602 Canterbury St Unit 14
- 602 Canterbury St Unit 4
- 602 Canterbury St Unit 5
- 602 Canterbury St Unit 2
- 602 Canterbury St Unit 9
- 579 American Legion Hwy
- 577-579 American Legion Hwy
- 36 Neponset Ave Unit 1
- 50 Southbourne Rd
- 29 Paine St
- 32 Jewett St
- 348-350 Hyde Park Ave Unit 2
- 18-20 Northbourne Rd Unit 18
- 31 Rodman St Unit 2
- 31 Rodman St Unit 1
- 8 Mount Calvary Rd Unit 4
- 65 Halliday St
- 73 Halliday St
- 167 Bourne St
- 64 Waterman Rd
- 61 Halliday St
- 54 Waterman Rd
- 68 Waterman Rd
- 72 Halliday St
- 57 Halliday St
- 66 Halliday St
- 74 Halliday St
- 48 Waterman Rd
- 62 Halliday St
- 53 Halliday St
- 53 Halliday St Unit 1
- 55 Waterman Rd
- 58 Halliday St
- 58 Halliday St Unit 1
- 58 Halliday St Unit SF
- 149 Bourne St