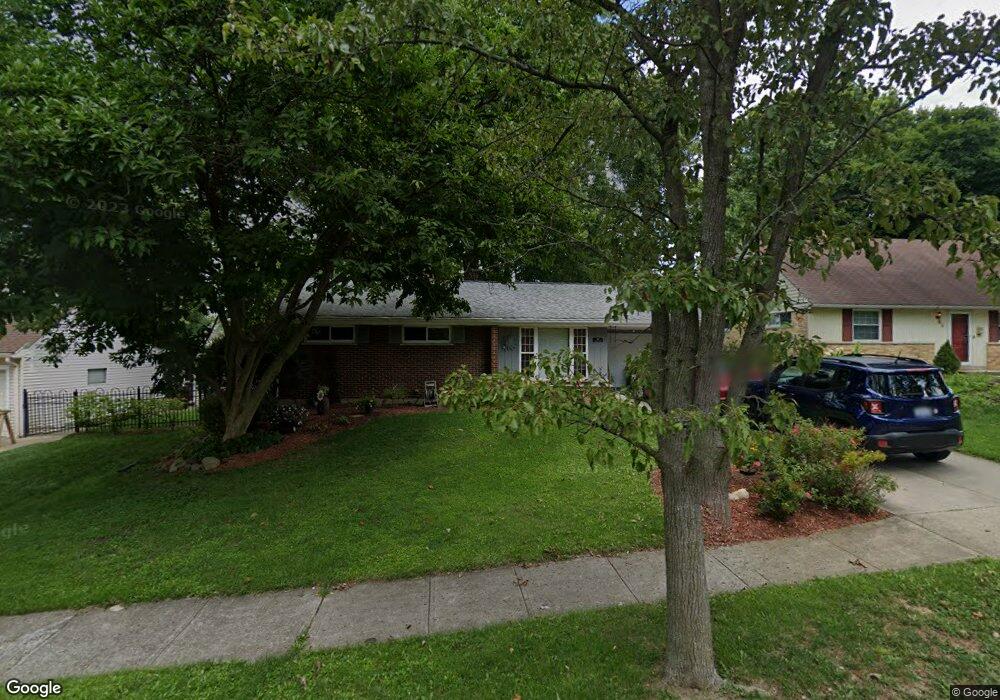
69 Hamlin Dr Cincinnati, OH 45218
Estimated Value: $150,000 - $202,000
3
Beds
1
Bath
972
Sq Ft
$192/Sq Ft
Est. Value
About This Home
This home is located at 69 Hamlin Dr, Cincinnati, OH 45218 and is currently estimated at $186,871, approximately $192 per square foot. 69 Hamlin Dr is a home located in Hamilton County with nearby schools including Central Montessori Academy.
Ownership History
Date
Name
Owned For
Owner Type
Purchase Details
Closed on
Sep 30, 2015
Sold by
Schmidt Elmer J L
Bought by
Mcaninch Kathleen Ann
Current Estimated Value
Home Financials for this Owner
Home Financials are based on the most recent Mortgage that was taken out on this home.
Original Mortgage
$49,300
Outstanding Balance
$18,768
Interest Rate
3.84%
Mortgage Type
Unknown
Estimated Equity
$168,103
Purchase Details
Closed on
Feb 19, 1993
Sold by
Schmidt Helen C
Bought by
Schmidt Elmer J L
Create a Home Valuation Report for This Property
The Home Valuation Report is an in-depth analysis detailing your home's value as well as a comparison with similar homes in the area
Home Values in the Area
Average Home Value in this Area
Purchase History
| Date | Buyer | Sale Price | Title Company |
|---|---|---|---|
| Mcaninch Kathleen Ann | $58,000 | Stewart Title Company | |
| Schmidt Elmer J L | -- | -- |
Source: Public Records
Mortgage History
| Date | Status | Borrower | Loan Amount |
|---|---|---|---|
| Open | Mcaninch Kathleen Ann | $49,300 |
Source: Public Records
Tax History
| Year | Tax Paid | Tax Assessment Tax Assessment Total Assessment is a certain percentage of the fair market value that is determined by local assessors to be the total taxable value of land and additions on the property. | Land | Improvement |
|---|---|---|---|---|
| 2025 | $3,840 | $52,966 | $9,877 | $43,089 |
| 2024 | $3,541 | $52,966 | $9,877 | $43,089 |
| 2023 | $3,299 | $52,966 | $9,877 | $43,089 |
| 2022 | $2,882 | $34,511 | $7,662 | $26,849 |
| 2021 | $2,823 | $34,511 | $7,662 | $26,849 |
| 2020 | $2,864 | $34,511 | $7,662 | $26,849 |
| 2019 | $2,785 | $29,495 | $6,549 | $22,946 |
| 2018 | $2,791 | $29,495 | $6,549 | $22,946 |
| 2017 | $2,587 | $29,495 | $6,549 | $22,946 |
| 2016 | $2,640 | $29,414 | $7,077 | $22,337 |
| 2015 | $1,737 | $29,414 | $7,077 | $22,337 |
| 2014 | $1,778 | $29,414 | $7,077 | $22,337 |
| 2013 | $1,938 | $31,973 | $7,693 | $24,280 |
Source: Public Records
Map
Nearby Homes
- 77 Handel Ln
- 68 Gambier Cir
- 30 Gambier Cir
- 37 Hayden Dr
- 835 Cascade Rd
- 749 Converse Dr
- 6 Chalmers Ct
- 11 Dewitt Ct
- 9 Dewitt Ct
- 7 Dewitt Ct
- 11 Ashby St
- 11131 Hanover Rd
- 683 Danbury Rd
- 1251 Waycross Rd
- 10619 Deauville Rd
- 1314 Waycross Rd
- 11315 Lincolnshire Dr
- 162 Sheffield Rd
- 11342 Kenshire Dr
- 1477 Kelvin Ct
Your Personal Tour Guide
Ask me questions while you tour the home.