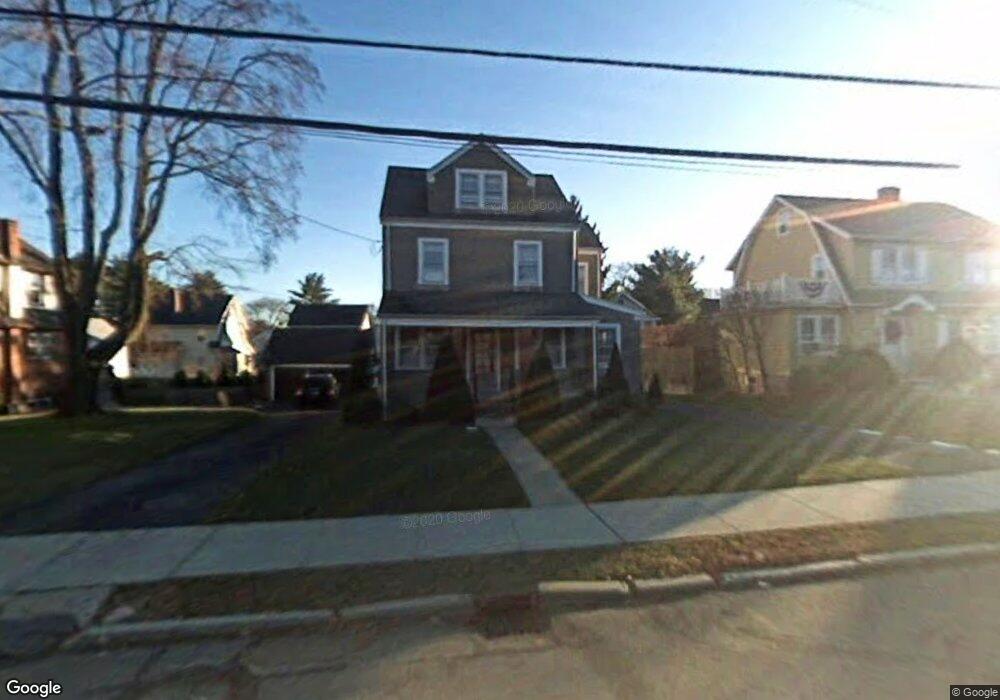
69 Hawley Ave Port Chester, NY 10573
Estimated Value: $694,000 - $827,000
2
Beds
2
Baths
1,523
Sq Ft
$487/Sq Ft
Est. Value
About This Home
This home is located at 69 Hawley Ave, Port Chester, NY 10573 and is currently estimated at $741,726, approximately $487 per square foot. 69 Hawley Ave is a home located in Westchester County with nearby schools including Port Chester Middle School, Port Chester Senior High School, and Corpus Christi Holy Rosary School.
Ownership History
Date
Name
Owned For
Owner Type
Purchase Details
Closed on
Dec 29, 2016
Sold by
Provenzano Rosanna
Bought by
Stellacci Laura V and Stellacci Theresa M
Current Estimated Value
Home Financials for this Owner
Home Financials are based on the most recent Mortgage that was taken out on this home.
Original Mortgage
$328,000
Outstanding Balance
$269,993
Interest Rate
4.08%
Mortgage Type
New Conventional
Estimated Equity
$471,733
Create a Home Valuation Report for This Property
The Home Valuation Report is an in-depth analysis detailing your home's value as well as a comparison with similar homes in the area
Home Values in the Area
Average Home Value in this Area
Purchase History
| Date | Buyer | Sale Price | Title Company |
|---|---|---|---|
| Stellacci Laura V | $410,000 | Judicial Title |
Source: Public Records
Mortgage History
| Date | Status | Borrower | Loan Amount |
|---|---|---|---|
| Open | Stellacci Laura V | $328,000 |
Source: Public Records
Tax History Compared to Growth
Tax History
| Year | Tax Paid | Tax Assessment Tax Assessment Total Assessment is a certain percentage of the fair market value that is determined by local assessors to be the total taxable value of land and additions on the property. | Land | Improvement |
|---|---|---|---|---|
| 2024 | $14,804 | $640,200 | $188,300 | $451,900 |
| 2023 | $14,078 | $621,600 | $179,400 | $442,200 |
| 2022 | $13,373 | $586,400 | $179,400 | $407,000 |
| 2021 | $14,435 | $543,000 | $179,400 | $363,600 |
| 2020 | $13,027 | $543,000 | $179,400 | $363,600 |
| 2019 | $17,606 | $447,000 | $162,500 | $284,500 |
| 2018 | $8,985 | $437,800 | $159,900 | $277,900 |
| 2017 | $1,864 | $434,400 | $158,700 | $275,700 |
| 2016 | $6,197 | $423,300 | $158,700 | $264,600 |
| 2015 | -- | $400,100 | $149,600 | $250,500 |
| 2014 | -- | $357,300 | $130,200 | $227,100 |
| 2013 | -- | $364,200 | $137,100 | $227,100 |
Source: Public Records
Map
Nearby Homes