


69 Hayward St Hopkinton, MA 01748
Estimated payment $1,198/month
Highlights
- Wooded Lot
- Elmwood Elementary School Rated A
- No HOA
About This Lot
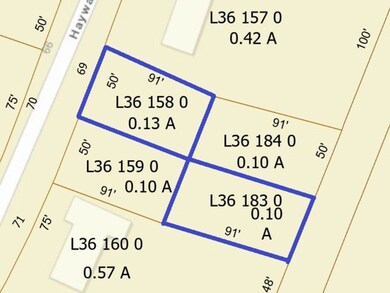
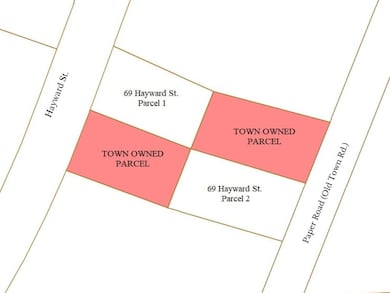
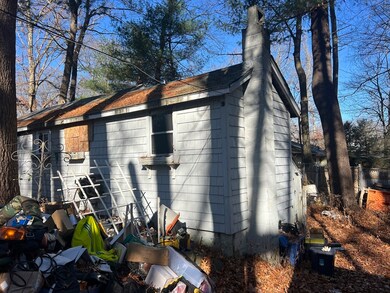
Property available just off 495 in quite lakeside community. It consists of two parcels, a .13 acre preexisting non conforming lot zoned Residential Lake Front with fire damaged structure and an additional .10 acre parcel. Parcel 1 has 50 Ft of frontage on Hayward St and is 91 feet deep. Parcel 2 is kitty corner from parcel 1 and is also 50 feet wide by 91 feet deep. Buyer to conduct all due diligence on zoning restrictions.
Property Details
Property Type
- Land
Est. Annual Taxes
- $2,684
Lot Details
- 5,663 Sq Ft Lot
- Wooded Lot
- Property is zoned RLF
Utilities
- Electricity To Lot Line
- Natural Gas Not Available
Community Details
- No Home Owners Association
Listing and Financial Details
- Assessor Parcel Number M:0L36 B:0158 L:0,530895
Map
Home Values in the Area
Average Home Value in this Area
Tax History
| Year | Tax Paid | Tax Assessment Tax Assessment Total Assessment is a certain percentage of the fair market value that is determined by local assessors to be the total taxable value of land and additions on the property. | Land | Improvement |
|---|---|---|---|---|
| 2025 | $2,735 | $192,900 | $192,900 | $0 |
| 2024 | $2,684 | $183,700 | $183,700 | $0 |
| 2023 | $4,615 | $291,900 | $161,200 | $130,700 |
| 2022 | $4,521 | $265,500 | $146,600 | $118,900 |
| 2021 | $4,388 | $256,900 | $142,100 | $114,800 |
| 2020 | $3,606 | $214,400 | $138,700 | $75,700 |
| 2019 | $3,448 | $200,800 | $133,600 | $67,200 |
| 2018 | $3,240 | $191,700 | $127,100 | $64,600 |
| 2017 | $3,123 | $185,900 | $123,400 | $62,500 |
| 2016 | $3,093 | $181,600 | $121,000 | $60,600 |
| 2015 | $3,112 | $173,300 | $117,600 | $55,700 |
Property History
| Date | Event | Price | List to Sale | Price per Sq Ft |
|---|---|---|---|---|
| 12/31/2024 12/31/24 | Pending | -- | -- | -- |
| 12/02/2024 12/02/24 | For Sale | $185,000 | -- | -- |
Purchase History
| Date | Type | Sale Price | Title Company |
|---|---|---|---|
| Deed | $196,500 | -- | |
| Deed | $196,500 | -- | |
| Deed | $79,400 | -- |
Mortgage History
| Date | Status | Loan Amount | Loan Type |
|---|---|---|---|
| Open | $176,800 | Purchase Money Mortgage | |
| Closed | $176,800 | Purchase Money Mortgage | |
| Previous Owner | $63,250 | Purchase Money Mortgage |
Source: MLS Property Information Network (MLS PIN)
MLS Number: 73316599
APN: HOPK-000036L-000158
Disclaimer: Certain information contained herein is derived from information provided by parties other than Homes.com. All information provided is deemed reliable, but is not guaranteed to be accurate and should be independently verified.
![]() The property listing data and information, or the Images, set forth herein were provided to MLS Property Information Network, Inc. from third party sources, including sellers, lessors and public records, and were compiled by MLS Property Information Network, Inc. The property listing data and information, and the Images, are for the personal, non-commercial use of consumers having a good faith interest in purchasing or leasing listed properties of the type displayed to them and may not be used for any purpose other than to identify prospective properties which such consumers may have a good faith interest in purchasing or leasing. MLS Property Information Network, Inc. and its subscribers disclaim any and all representations and warranties as to the accuracy of the property listing data and information, or as to the accuracy of any of the Images, set forth herein.
The property listing data and information, or the Images, set forth herein were provided to MLS Property Information Network, Inc. from third party sources, including sellers, lessors and public records, and were compiled by MLS Property Information Network, Inc. The property listing data and information, and the Images, are for the personal, non-commercial use of consumers having a good faith interest in purchasing or leasing listed properties of the type displayed to them and may not be used for any purpose other than to identify prospective properties which such consumers may have a good faith interest in purchasing or leasing. MLS Property Information Network, Inc. and its subscribers disclaim any and all representations and warranties as to the accuracy of the property listing data and information, or as to the accuracy of any of the Images, set forth herein.
