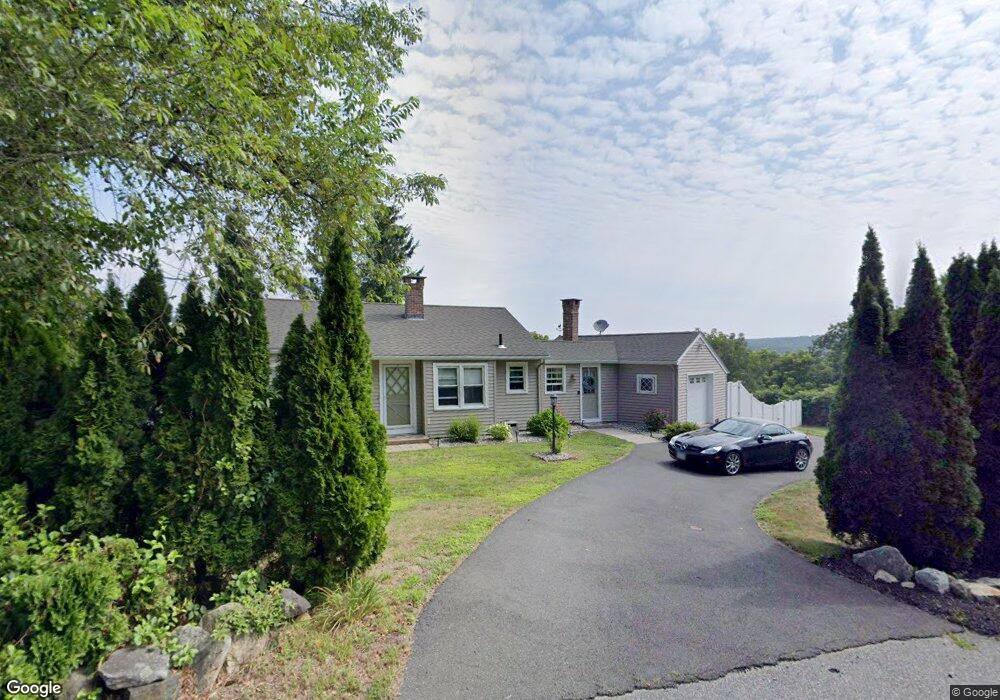
69 High St Monson, MA 01057
Estimated Value: $248,000 - $325,666
2
Beds
2
Baths
736
Sq Ft
$405/Sq Ft
Est. Value
About This Home
This home is located at 69 High St, Monson, MA 01057 and is currently estimated at $298,417, approximately $405 per square foot. 69 High St is a home located in Hampden County with nearby schools including Quarry Hill Community School, Granite Valley School, and Monson High School.
Ownership History
Date
Name
Owned For
Owner Type
Purchase Details
Closed on
Sep 3, 2009
Sold by
Barrett Lisa J
Bought by
Lemonde Shannon
Current Estimated Value
Home Financials for this Owner
Home Financials are based on the most recent Mortgage that was taken out on this home.
Original Mortgage
$167,280
Outstanding Balance
$109,512
Interest Rate
5.21%
Mortgage Type
Purchase Money Mortgage
Estimated Equity
$188,905
Purchase Details
Closed on
Jan 24, 2008
Sold by
Cardin Edward A and Cardin Karen A
Bought by
Barrett Lisa J
Home Financials for this Owner
Home Financials are based on the most recent Mortgage that was taken out on this home.
Original Mortgage
$100,000
Interest Rate
6.17%
Mortgage Type
Purchase Money Mortgage
Purchase Details
Closed on
Jul 10, 1996
Sold by
Nichols Scott F and Nichols Valerie J
Bought by
Hibbard Robert E
Home Financials for this Owner
Home Financials are based on the most recent Mortgage that was taken out on this home.
Original Mortgage
$86,000
Interest Rate
7.98%
Mortgage Type
Purchase Money Mortgage
Purchase Details
Closed on
Oct 12, 1989
Sold by
Kubaska Nora J
Bought by
Nichols Scott F
Create a Home Valuation Report for This Property
The Home Valuation Report is an in-depth analysis detailing your home's value as well as a comparison with similar homes in the area
Home Values in the Area
Average Home Value in this Area
Purchase History
| Date | Buyer | Sale Price | Title Company |
|---|---|---|---|
| Lemonde Shannon | $164,000 | -- | |
| Barrett Lisa J | $174,900 | -- | |
| Hibbard Robert E | $96,000 | -- | |
| Nichols Scott F | $108,500 | -- |
Source: Public Records
Mortgage History
| Date | Status | Borrower | Loan Amount |
|---|---|---|---|
| Open | Lemonde Shannon | $167,280 | |
| Previous Owner | Barrett Lisa J | $100,000 | |
| Previous Owner | Nichols Scott F | $114,845 | |
| Previous Owner | Nichols Scott F | $76,000 | |
| Previous Owner | Nichols Scott F | $86,000 |
Source: Public Records
Tax History Compared to Growth
Tax History
| Year | Tax Paid | Tax Assessment Tax Assessment Total Assessment is a certain percentage of the fair market value that is determined by local assessors to be the total taxable value of land and additions on the property. | Land | Improvement |
|---|---|---|---|---|
| 2025 | $3,596 | $241,800 | $54,400 | $187,400 |
| 2024 | $3,534 | $228,000 | $54,400 | $173,600 |
| 2023 | $3,324 | $209,600 | $54,400 | $155,200 |
| 2022 | $3,183 | $178,500 | $54,400 | $124,100 |
| 2021 | $3,336 | $167,500 | $54,400 | $113,100 |
| 2020 | $3,060 | $167,500 | $54,400 | $113,100 |
| 2019 | $3,339 | $160,500 | $54,400 | $106,100 |
| 2018 | $2,846 | $161,700 | $60,400 | $101,300 |
| 2017 | $3,318 | $155,900 | $58,100 | $97,800 |
| 2016 | $2,664 | $155,600 | $57,800 | $97,800 |
| 2015 | $2,594 | $155,600 | $57,800 | $97,800 |
| 2014 | $2,521 | $155,600 | $57,800 | $97,800 |
Source: Public Records
Map
Nearby Homes