Estimated Value: $531,000 - $621,000
3
Beds
2
Baths
1,452
Sq Ft
$396/Sq Ft
Est. Value
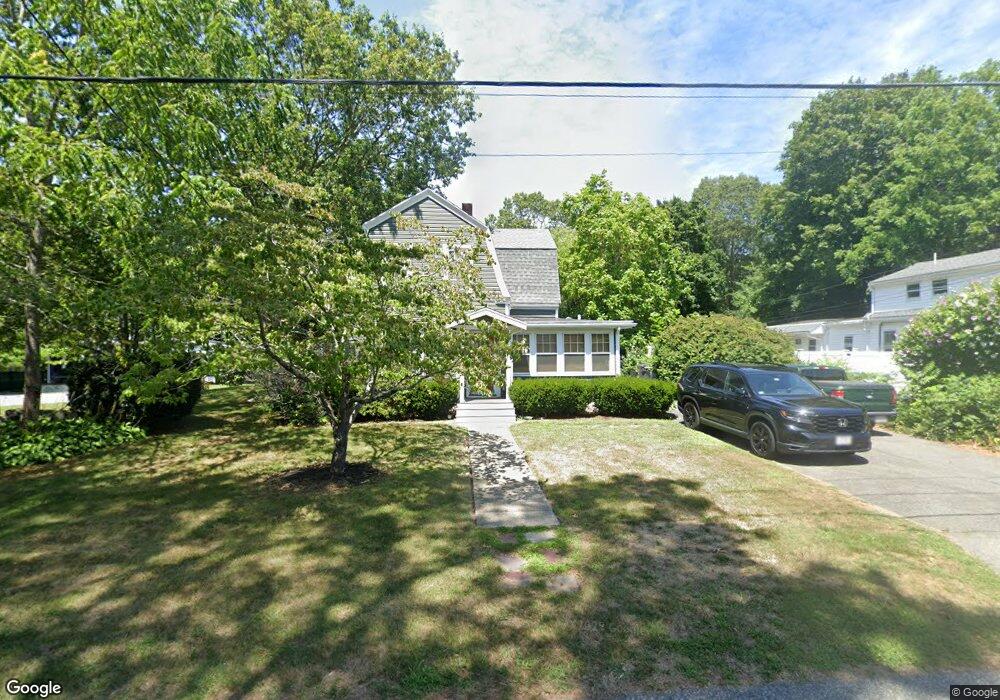
About This Home
This home is located at 69 Highland St, Avon, MA 02322 and is currently estimated at $575,255, approximately $396 per square foot. 69 Highland St is a home located in Norfolk County with nearby schools including Ralph D. Butler Elementary School and Avon Middle/High School.
Ownership History
Date
Name
Owned For
Owner Type
Purchase Details
Closed on
Mar 15, 2010
Sold by
Tremblay Gary J
Bought by
Caffelle Richard and Caffelle Darcy
Current Estimated Value
Home Financials for this Owner
Home Financials are based on the most recent Mortgage that was taken out on this home.
Original Mortgage
$279,837
Outstanding Balance
$190,224
Interest Rate
5.5%
Mortgage Type
FHA
Estimated Equity
$385,031
Purchase Details
Closed on
Aug 28, 2009
Sold by
Lasalle Bk
Bought by
Tremblay Gary
Home Financials for this Owner
Home Financials are based on the most recent Mortgage that was taken out on this home.
Original Mortgage
$92,080
Interest Rate
5.17%
Mortgage Type
Purchase Money Mortgage
Purchase Details
Closed on
Jan 5, 2009
Sold by
Schlosky Ronald
Bought by
Lasalle Bk
Create a Home Valuation Report for This Property
The Home Valuation Report is an in-depth analysis detailing your home's value as well as a comparison with similar homes in the area
Home Values in the Area
Average Home Value in this Area
Purchase History
| Date | Buyer | Sale Price | Title Company |
|---|---|---|---|
| Caffelle Richard | $285,000 | -- | |
| Tremblay Gary | $90,000 | -- | |
| Lasalle Bk | $153,731 | -- |
Source: Public Records
Mortgage History
| Date | Status | Borrower | Loan Amount |
|---|---|---|---|
| Open | Caffelle Richard | $279,837 | |
| Previous Owner | Tremblay Gary | $92,080 |
Source: Public Records
Tax History Compared to Growth
Tax History
| Year | Tax Paid | Tax Assessment Tax Assessment Total Assessment is a certain percentage of the fair market value that is determined by local assessors to be the total taxable value of land and additions on the property. | Land | Improvement |
|---|---|---|---|---|
| 2025 | $66 | $491,400 | $223,800 | $267,600 |
| 2024 | $6,092 | $434,200 | $202,900 | $231,300 |
| 2023 | $5,914 | $434,200 | $202,900 | $231,300 |
| 2022 | $5,938 | $375,600 | $169,400 | $206,200 |
| 2021 | $5,618 | $334,800 | $153,600 | $181,200 |
| 2020 | $5,002 | $282,600 | $150,500 | $132,100 |
| 2019 | $4,758 | $264,500 | $143,700 | $120,800 |
| 2018 | $4,906 | $264,500 | $143,700 | $120,800 |
| 2017 | $4,626 | $267,700 | $143,700 | $124,000 |
| 2016 | $4,673 | $273,100 | $137,000 | $136,100 |
| 2015 | $4,102 | $250,600 | $130,700 | $119,900 |
Source: Public Records
Map
Nearby Homes