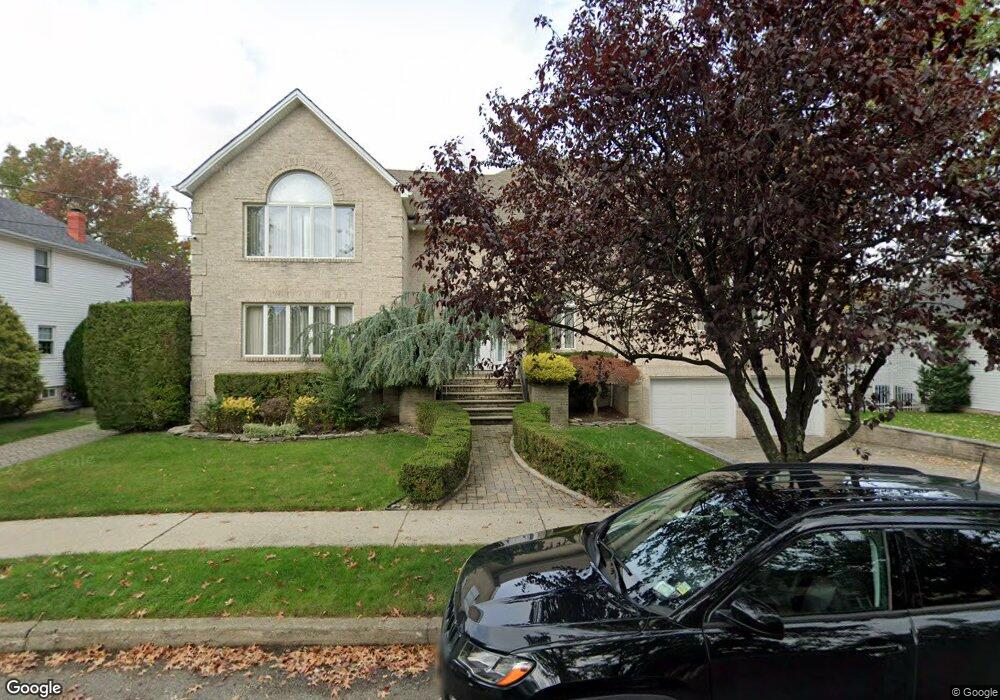
69 Jacob St Staten Island, NY 10307
Tottenville NeighborhoodEstimated Value: $1,292,000 - $1,709,000
--
Bed
4
Baths
4,000
Sq Ft
$367/Sq Ft
Est. Value
About This Home
This home is located at 69 Jacob St, Staten Island, NY 10307 and is currently estimated at $1,469,616, approximately $367 per square foot. 69 Jacob St is a home located in Richmond County with nearby schools including P.S. 6 Cpl Allan F Kivlehan School, Is 34 Tottenville, and Tottenville High School.
Ownership History
Date
Name
Owned For
Owner Type
Purchase Details
Closed on
Sep 4, 2020
Sold by
Masucci Raymond and Masucci Lisa
Bought by
Masucci Raymond
Current Estimated Value
Purchase Details
Closed on
Aug 13, 1997
Sold by
The City Of New York
Bought by
Masucci Raymond
Home Financials for this Owner
Home Financials are based on the most recent Mortgage that was taken out on this home.
Original Mortgage
$111,000
Interest Rate
9%
Mortgage Type
Seller Take Back
Create a Home Valuation Report for This Property
The Home Valuation Report is an in-depth analysis detailing your home's value as well as a comparison with similar homes in the area
Home Values in the Area
Average Home Value in this Area
Purchase History
| Date | Buyer | Sale Price | Title Company |
|---|---|---|---|
| Masucci Raymond | -- | None Available | |
| Masucci Raymond | $178,500 | -- | |
| Masucci Raymond | $60,000 | -- | |
| Masucci Raymond | $185,000 | -- |
Source: Public Records
Mortgage History
| Date | Status | Borrower | Loan Amount |
|---|---|---|---|
| Closed | Masucci Raymond | $111,000 | |
| Closed | Masucci Raymond | $30,000 | |
| Closed | Masucci Raymond | $107,100 |
Source: Public Records
Tax History Compared to Growth
Tax History
| Year | Tax Paid | Tax Assessment Tax Assessment Total Assessment is a certain percentage of the fair market value that is determined by local assessors to be the total taxable value of land and additions on the property. | Land | Improvement |
|---|---|---|---|---|
| 2025 | $13,823 | $68,280 | $24,680 | $43,600 |
| 2024 | $13,823 | $68,820 | $25,259 | $43,561 |
| 2023 | $14,418 | $70,992 | $20,382 | $50,610 |
| 2022 | $14,172 | $81,180 | $23,100 | $58,080 |
| 2021 | $14,652 | $81,120 | $23,100 | $58,020 |
| 2020 | $14,070 | $89,640 | $23,100 | $66,540 |
| 2019 | $13,118 | $83,220 | $23,100 | $60,120 |
| 2018 | $12,060 | $59,160 | $23,100 | $36,060 |
| 2017 | $12,537 | $61,501 | $22,274 | $39,227 |
| 2016 | $11,599 | $58,020 | $23,100 | $34,920 |
| 2015 | $10,916 | $60,292 | $17,007 | $43,285 |
| 2014 | $10,916 | $56,880 | $19,260 | $37,620 |
Source: Public Records
Map
Nearby Homes