69 Kenyon Rd Cranston, RI 02910
Eden Park NeighborhoodEstimated Value: $445,053 - $491,000
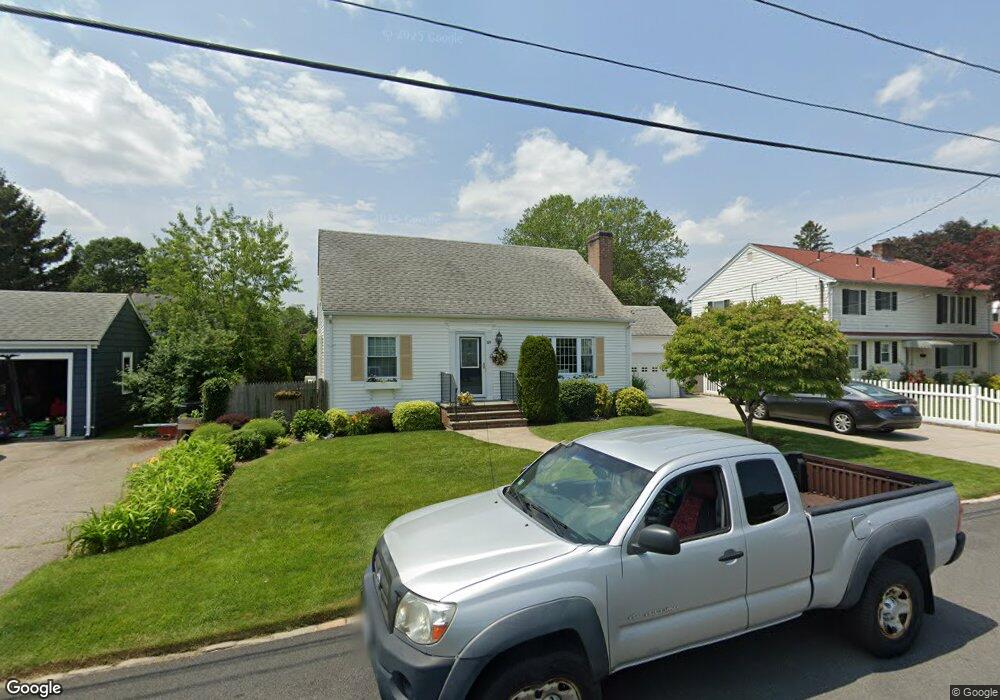
About This Home
This home is located at 69 Kenyon Rd, Cranston, RI 02910 and is currently estimated at $466,263, approximately $316 per square foot. 69 Kenyon Rd is a home located in Providence County with nearby schools including Park View Middle School, Cranston High School East, and Cadence Academy Preschool - Cranston.
Ownership History
We collect this data history from publicly available records. To have your information removed, we recommend requesting removal directly through your county’s website.
Purchase Details
Home Values in the Area
Average Home Value in this Area
Purchase History
We collect this data history from publicly available records. To have your information removed, we recommend requesting removal directly through your county’s website.
| Date | Buyer | Sale Price | Title Company |
|---|---|---|---|
| -- | -- |
Mortgage History
We collect this data history from publicly available records. To have your information removed, we recommend requesting removal directly through your county’s website.
| Date | Status | Borrower | Loan Amount |
|---|---|---|---|
| Previous Owner | $60,000 | ||
| Previous Owner | $40,000 | ||
| Previous Owner | $75,000 | ||
| Previous Owner | $30,000 |
Tax History
We collect this data history from publicly available records. To have your information removed, we recommend requesting removal directly through your county’s website.
| Year | Tax Paid | Tax Assessment Tax Assessment Total Assessment is a certain percentage of the fair market value that is determined by local assessors to be the total taxable value of land and additions on the property. | Land | Improvement |
|---|---|---|---|---|
| 2025 | $5,079 | $365,900 | $109,400 | $256,500 |
| 2024 | $4,893 | $359,500 | $109,400 | $250,100 |
| 2023 | $4,608 | $243,800 | $72,000 | $171,800 |
| 2022 | $4,513 | $243,800 | $72,000 | $171,800 |
| 2021 | $4,388 | $243,800 | $72,000 | $171,800 |
| 2020 | $4,187 | $201,600 | $68,600 | $133,000 |
| 2019 | $4,187 | $201,600 | $68,600 | $133,000 |
| 2018 | $4,090 | $201,600 | $68,600 | $133,000 |
| 2017 | $4,157 | $181,200 | $61,800 | $119,400 |
| 2016 | $4,068 | $181,200 | $61,800 | $119,400 |
| 2015 | $4,068 | $181,200 | $61,800 | $119,400 |
| 2014 | $3,981 | $174,300 | $61,800 | $112,500 |
Map
- 17 Forest Ave Unit 19
- 27 Hemlock Ave
- 685 Pontiac Ave
- 41 Ash Ave
- 22 Waldron Ave
- 72 Fairweather Ave
- 70 Holburn Ave
- 44 Holburn Ave
- 84 Ash Ave
- 70 Glenwood Ave
- 58 Davis Ave
- 142 Richard St
- 56 Oakland Ave
- 21 Euston Ave
- 111 Waldron Ave
- 150 Riverside Ave
- 110 Laurens St
- 103 Oakland Ave
- 36 Blackamore Ave
- 9 Gardner Ave
Ask me questions while you tour the home.